Screenshots
A tour of every UI picosnitch ships with.
Web UI
The web UI runs locally (picosnitch webui) and reads the same SQLite
log shown elsewhere. It paints a stacked bandwidth chart, a sortable
top-contributors table, and a per-axis breakdown sidebar.
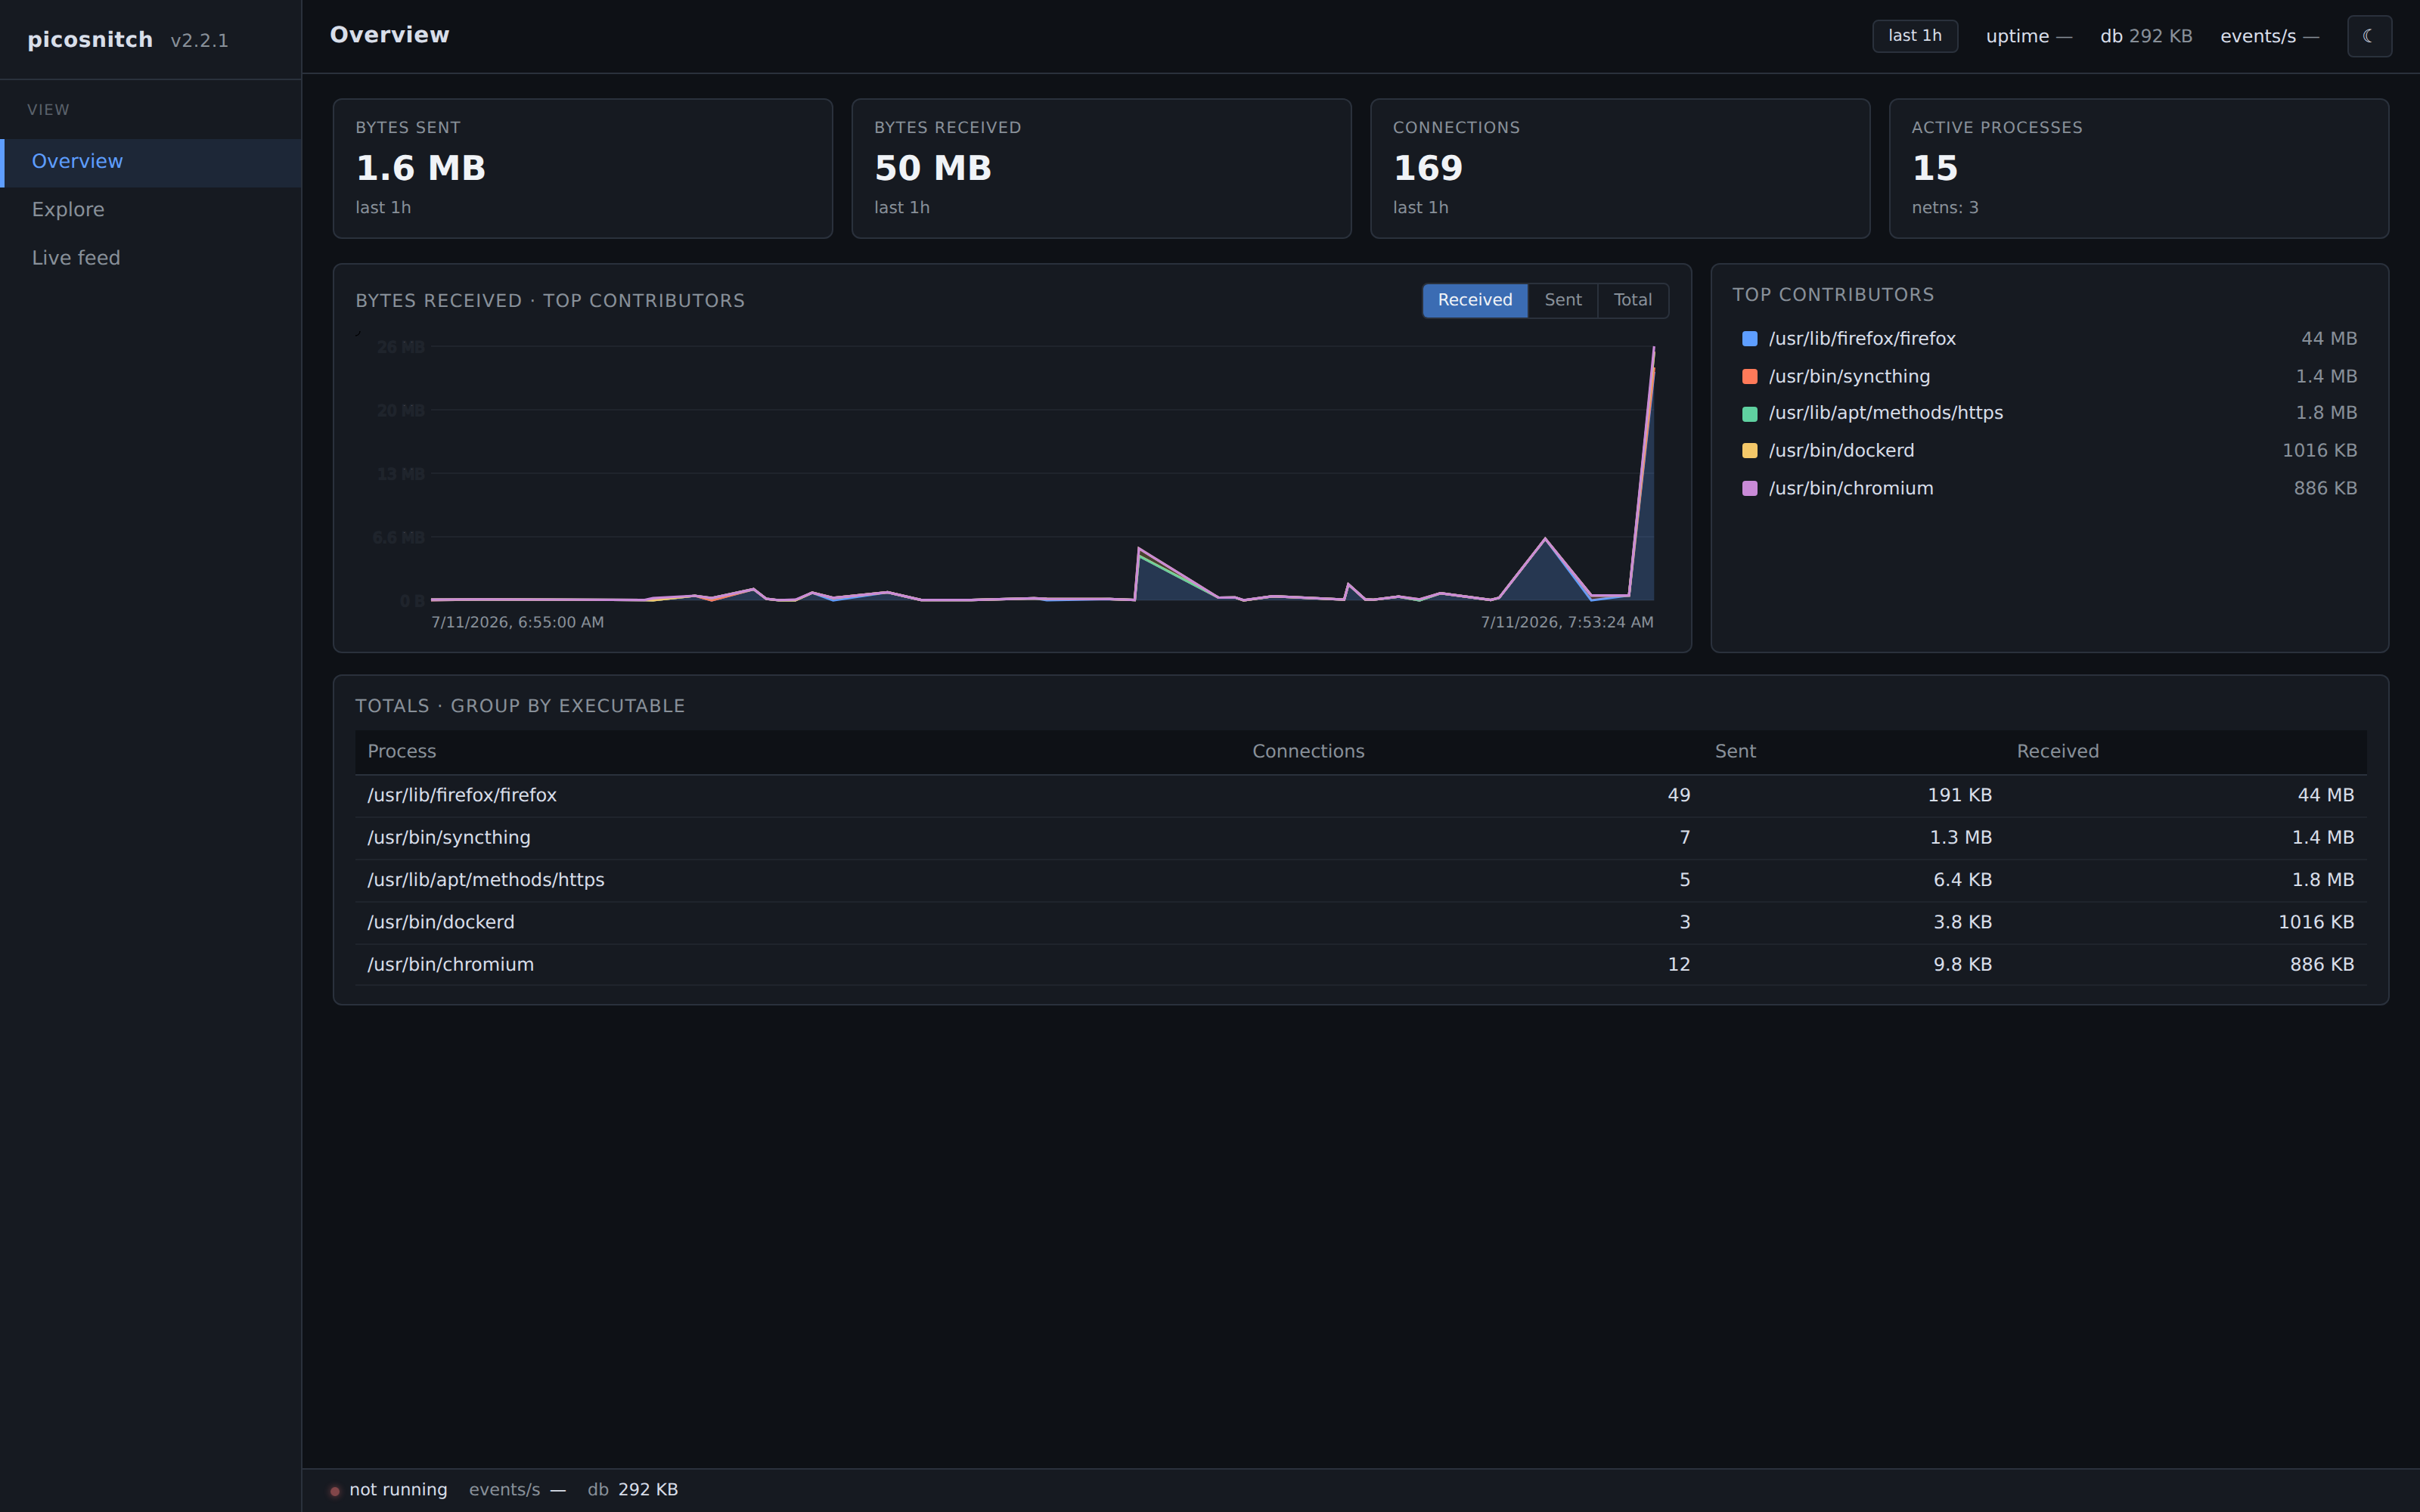
Overview
The default landing tab. Bandwidth over time, grouped by executable by default, with top contributors below the chart.
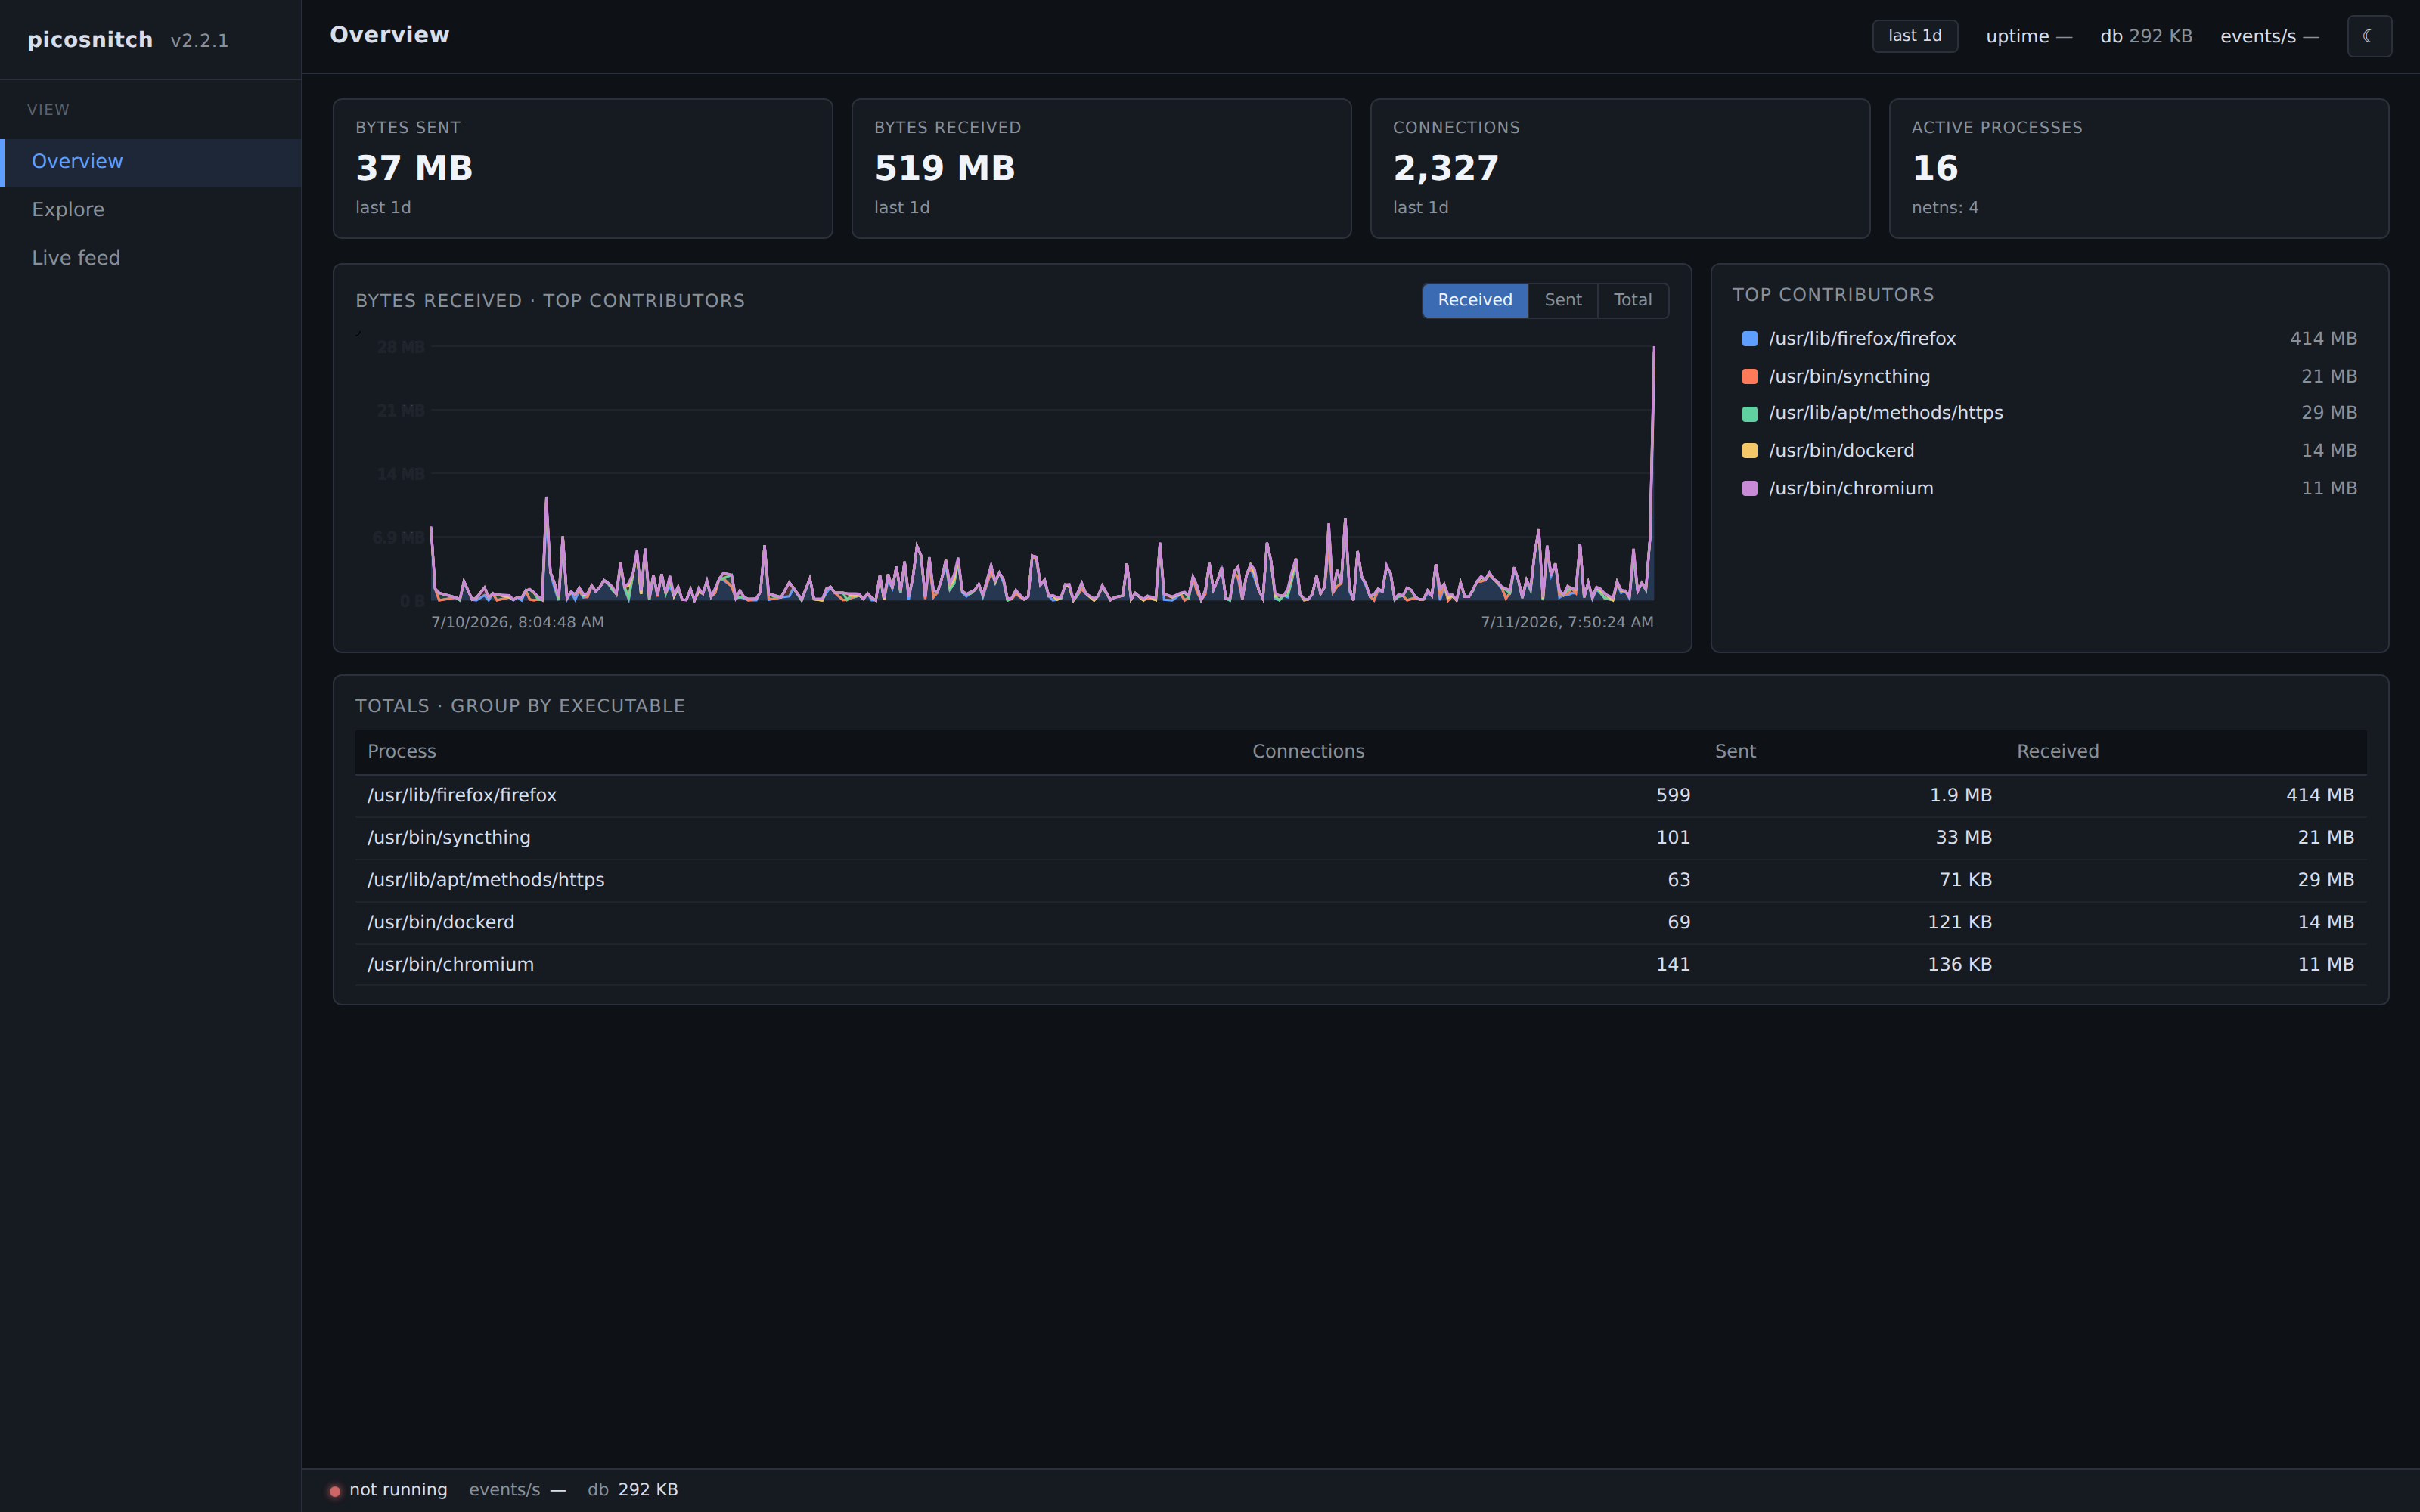
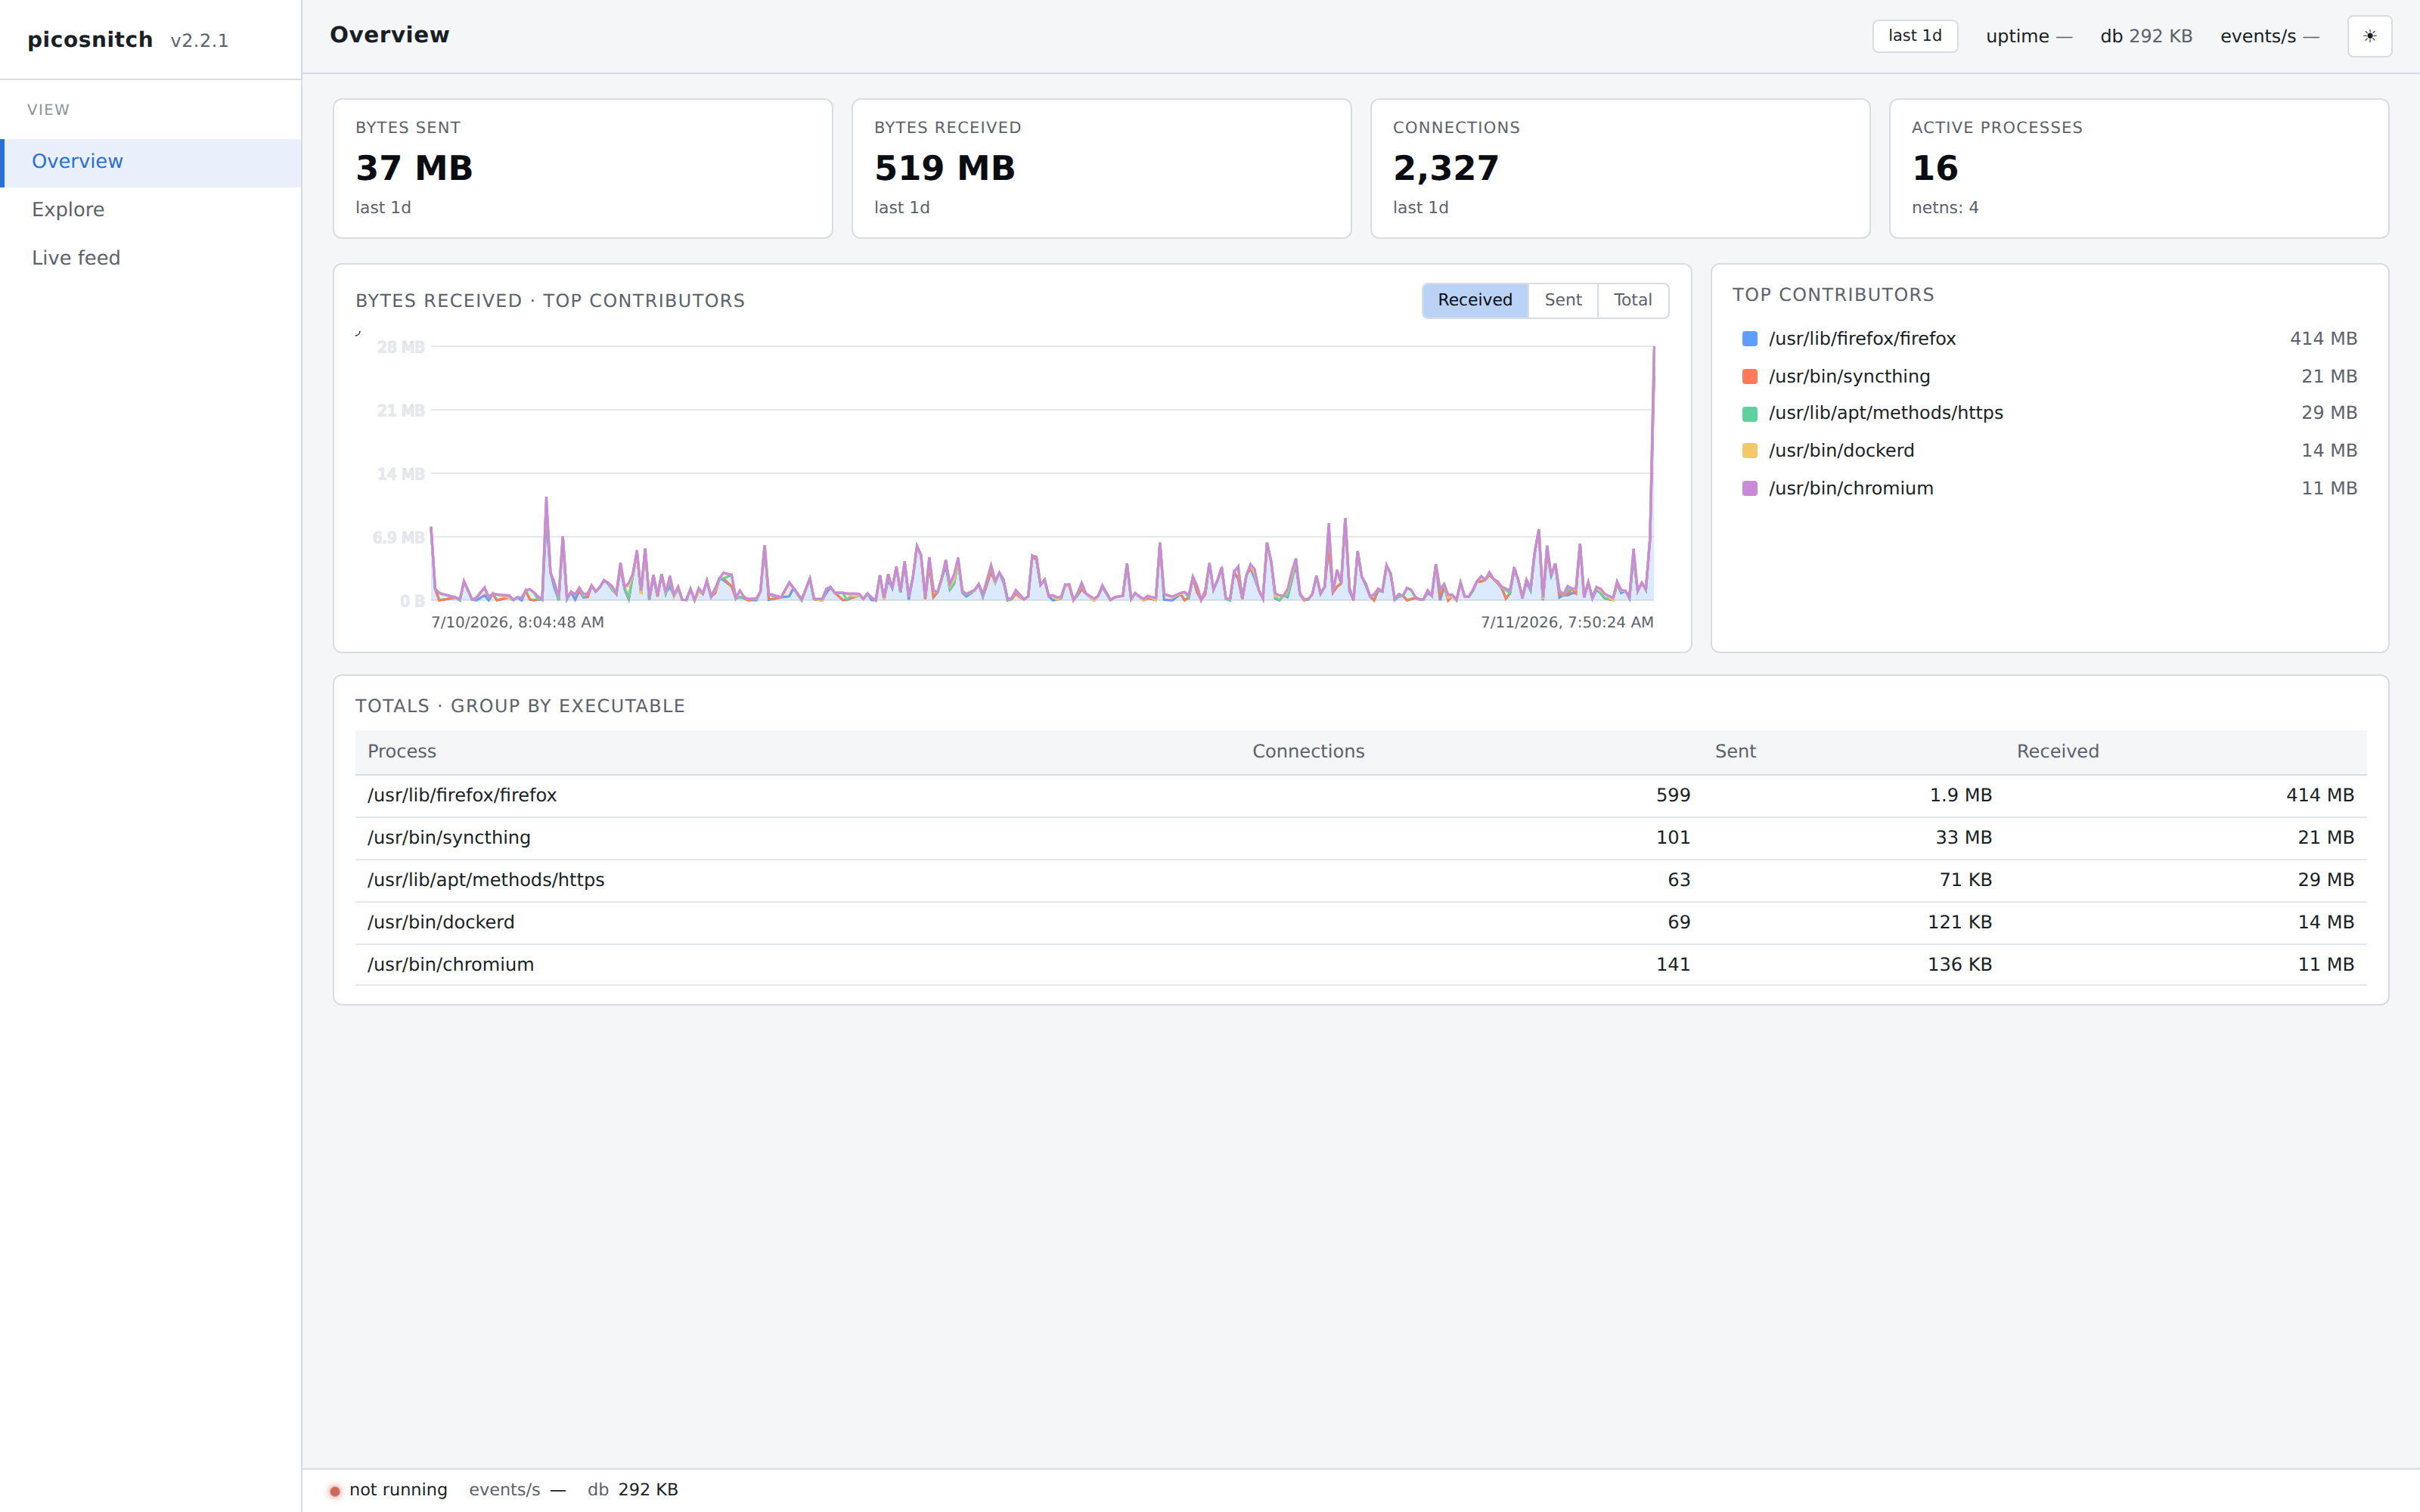
Light theme
Themes follow the system preference. Both palettes use the same chart and tables.
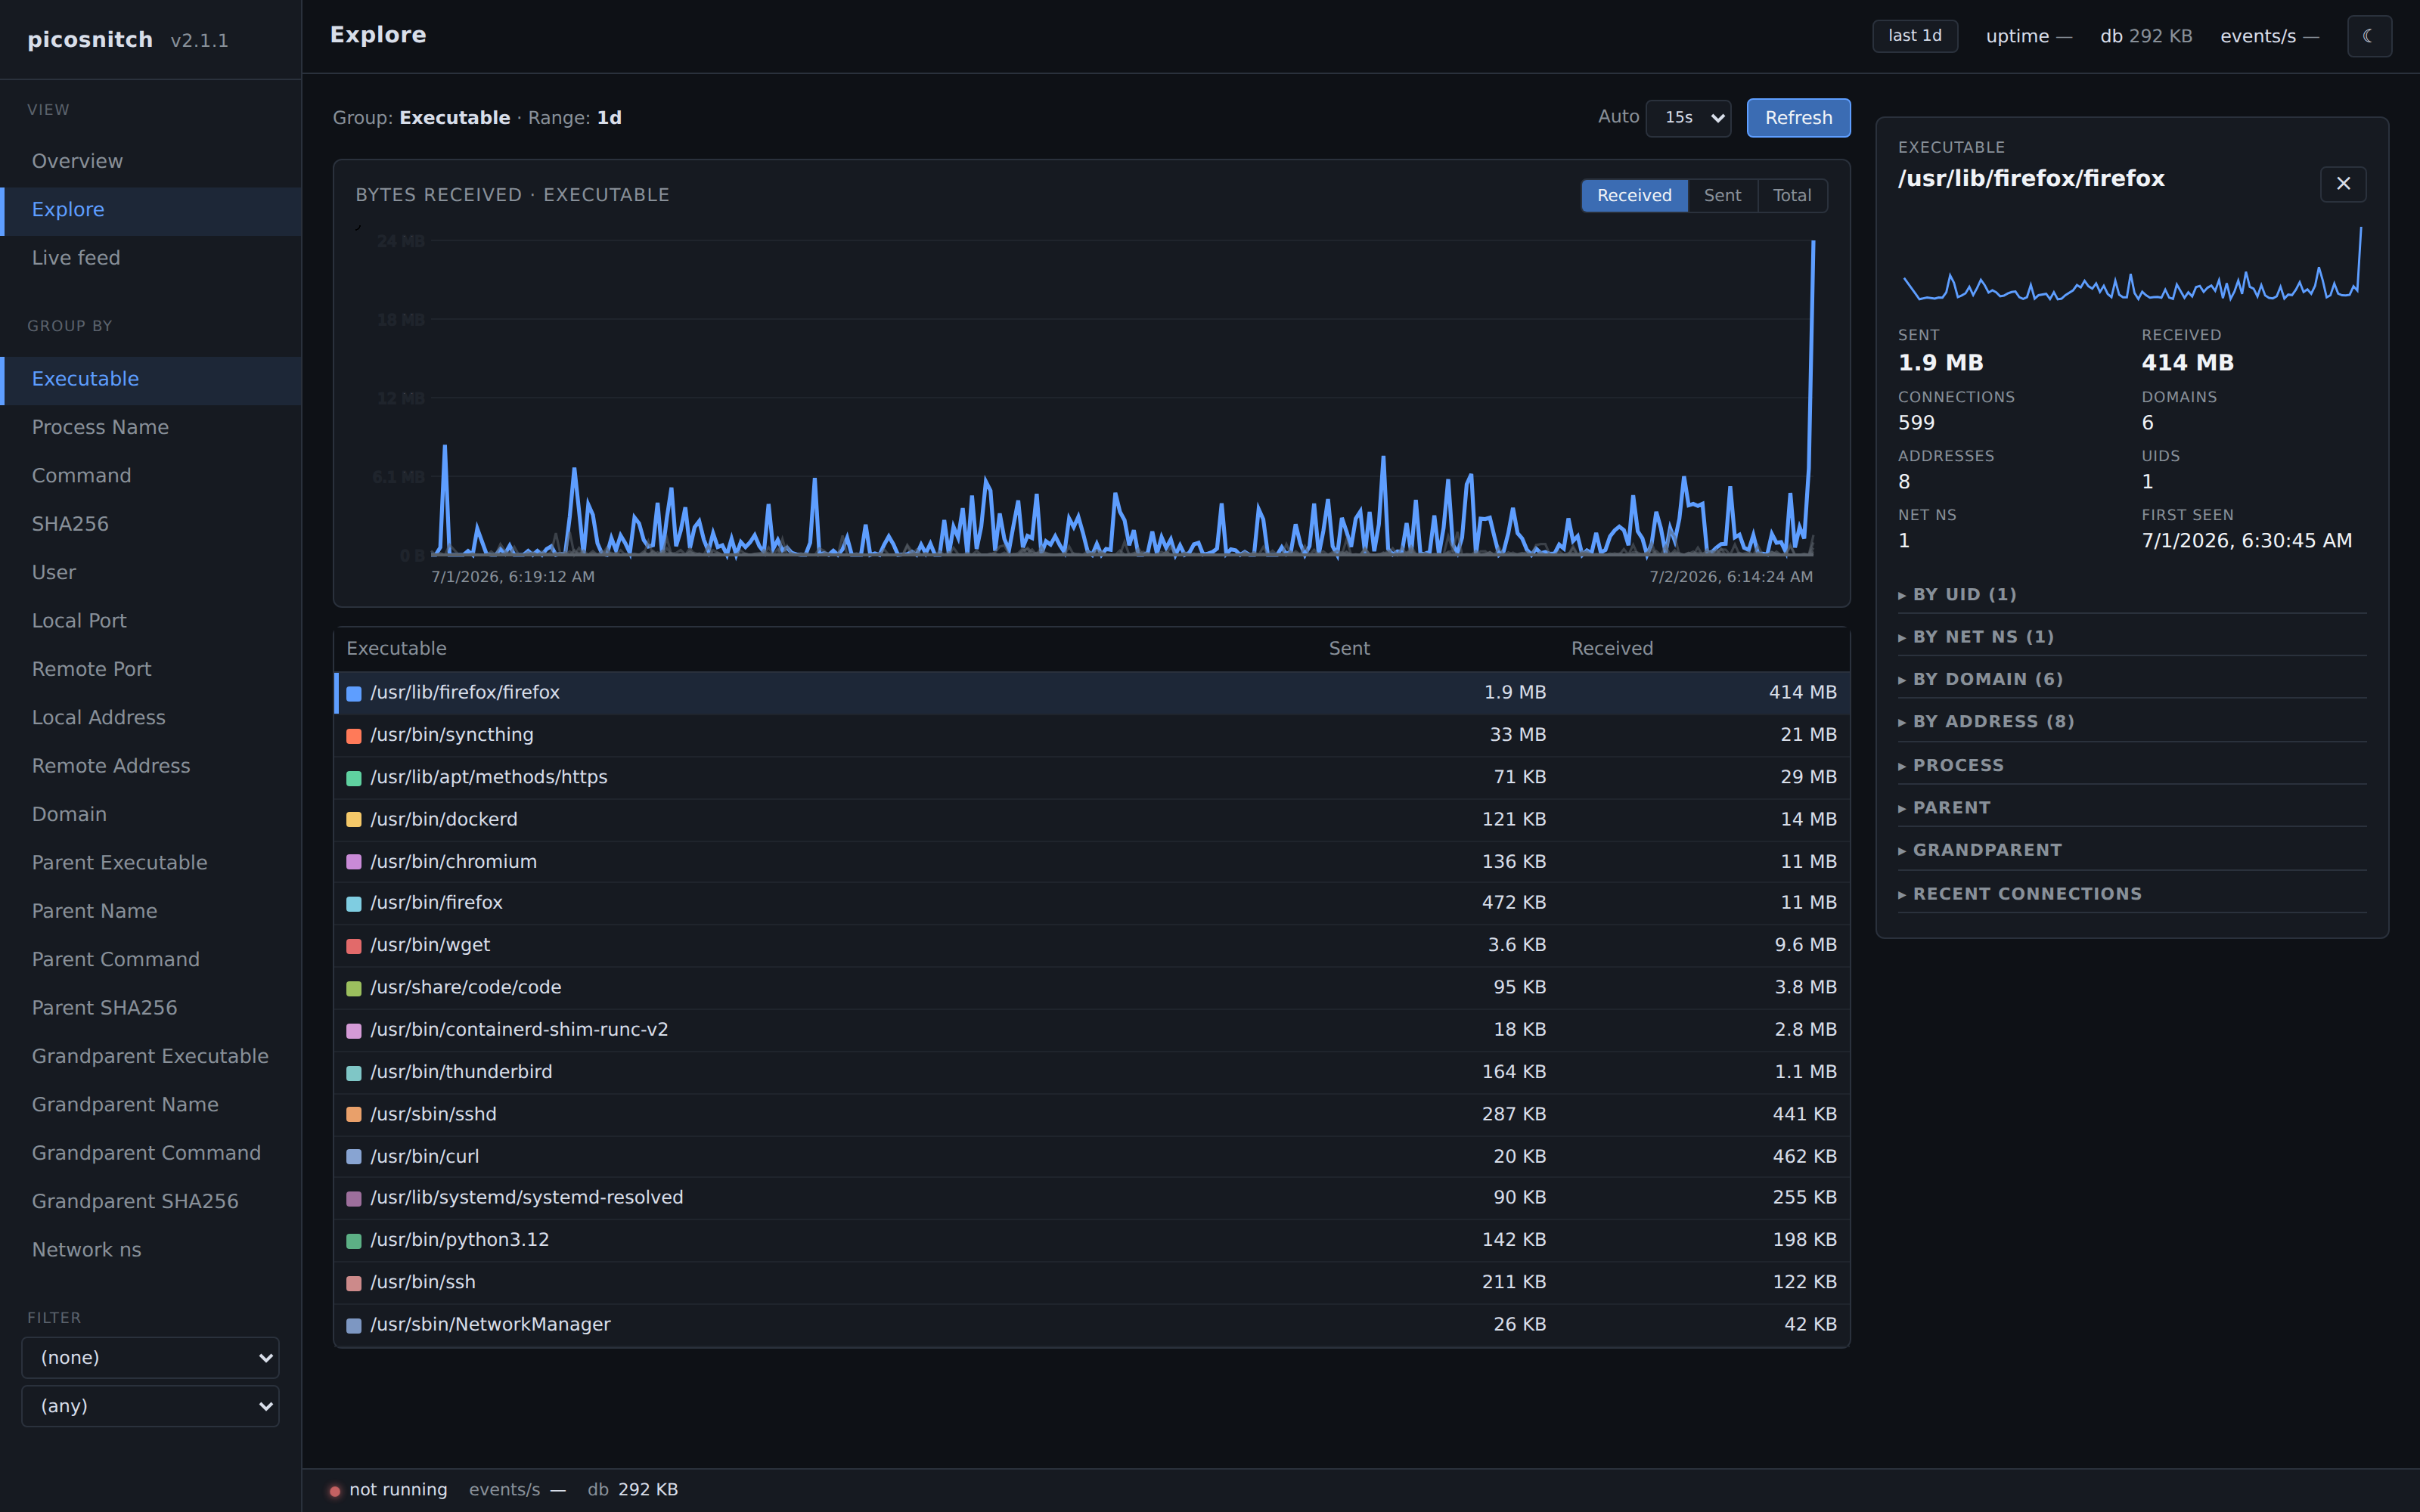
Group by executable
Pick any of the dimensions in the sidebar to re-bucket the chart and table. Grouping by executable shows which binaries are responsible for the bytes on the wire, with a drill-down panel on the right.
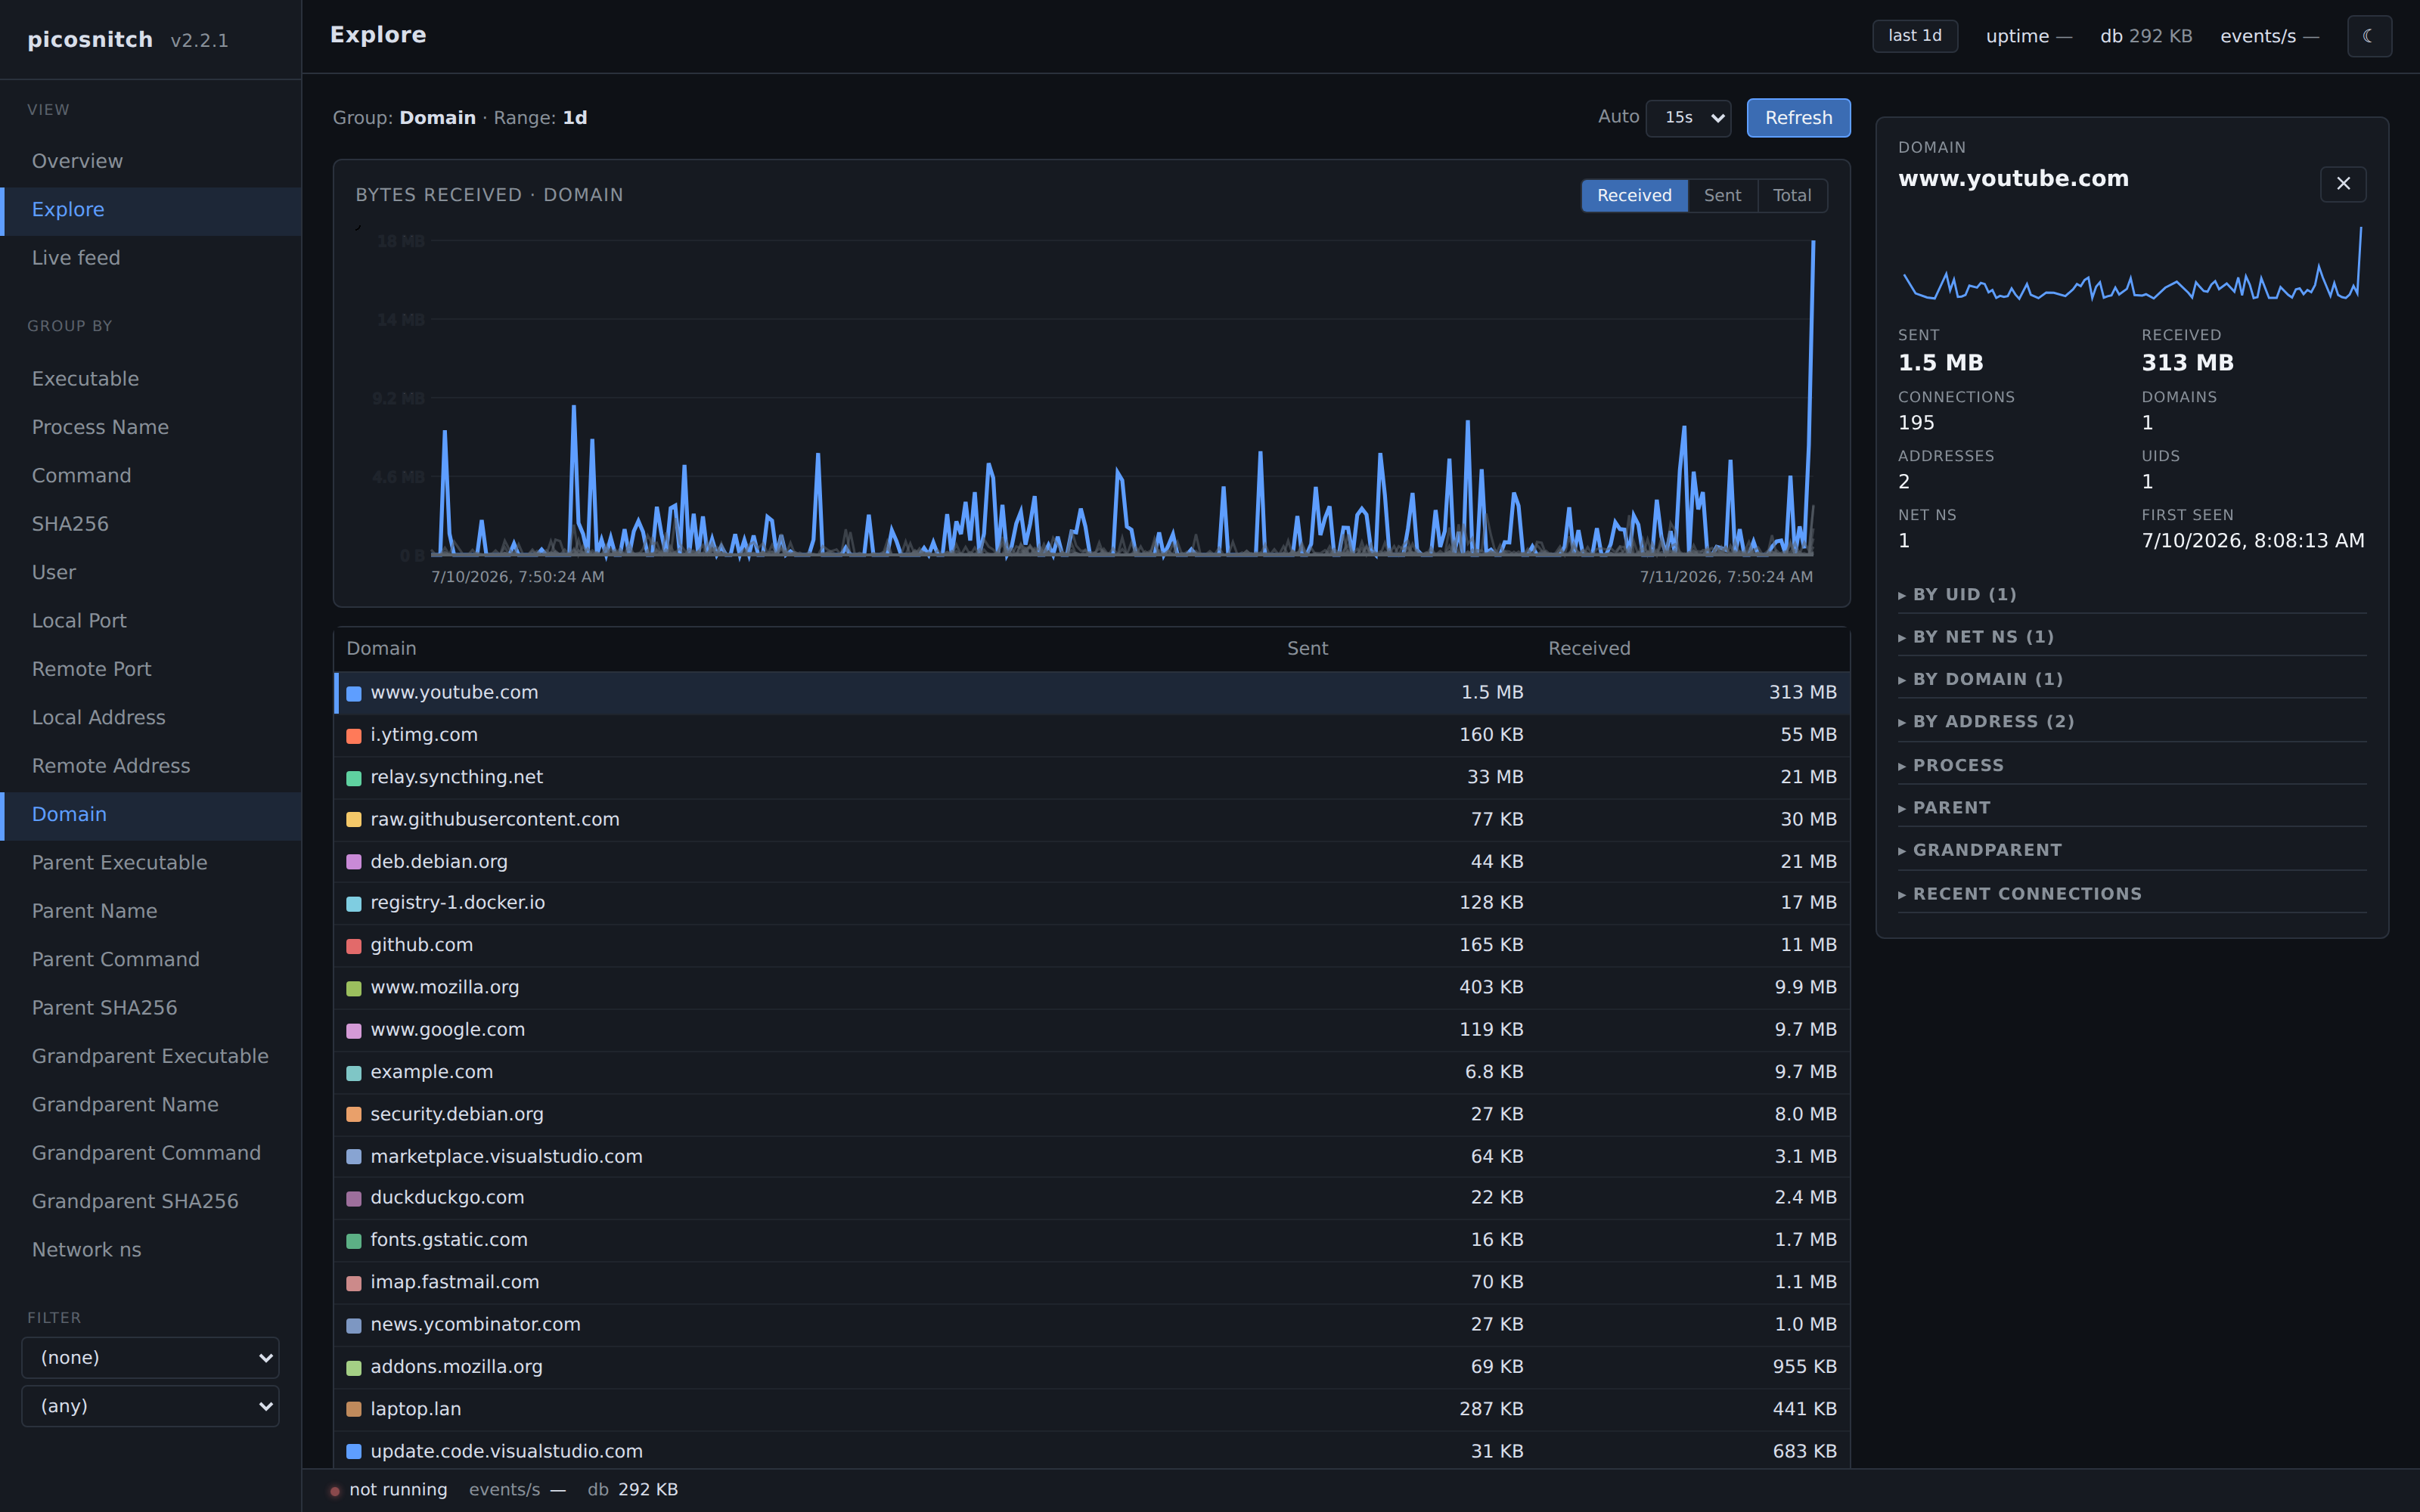
Group by domain
The same view, regrouped by DNS name.
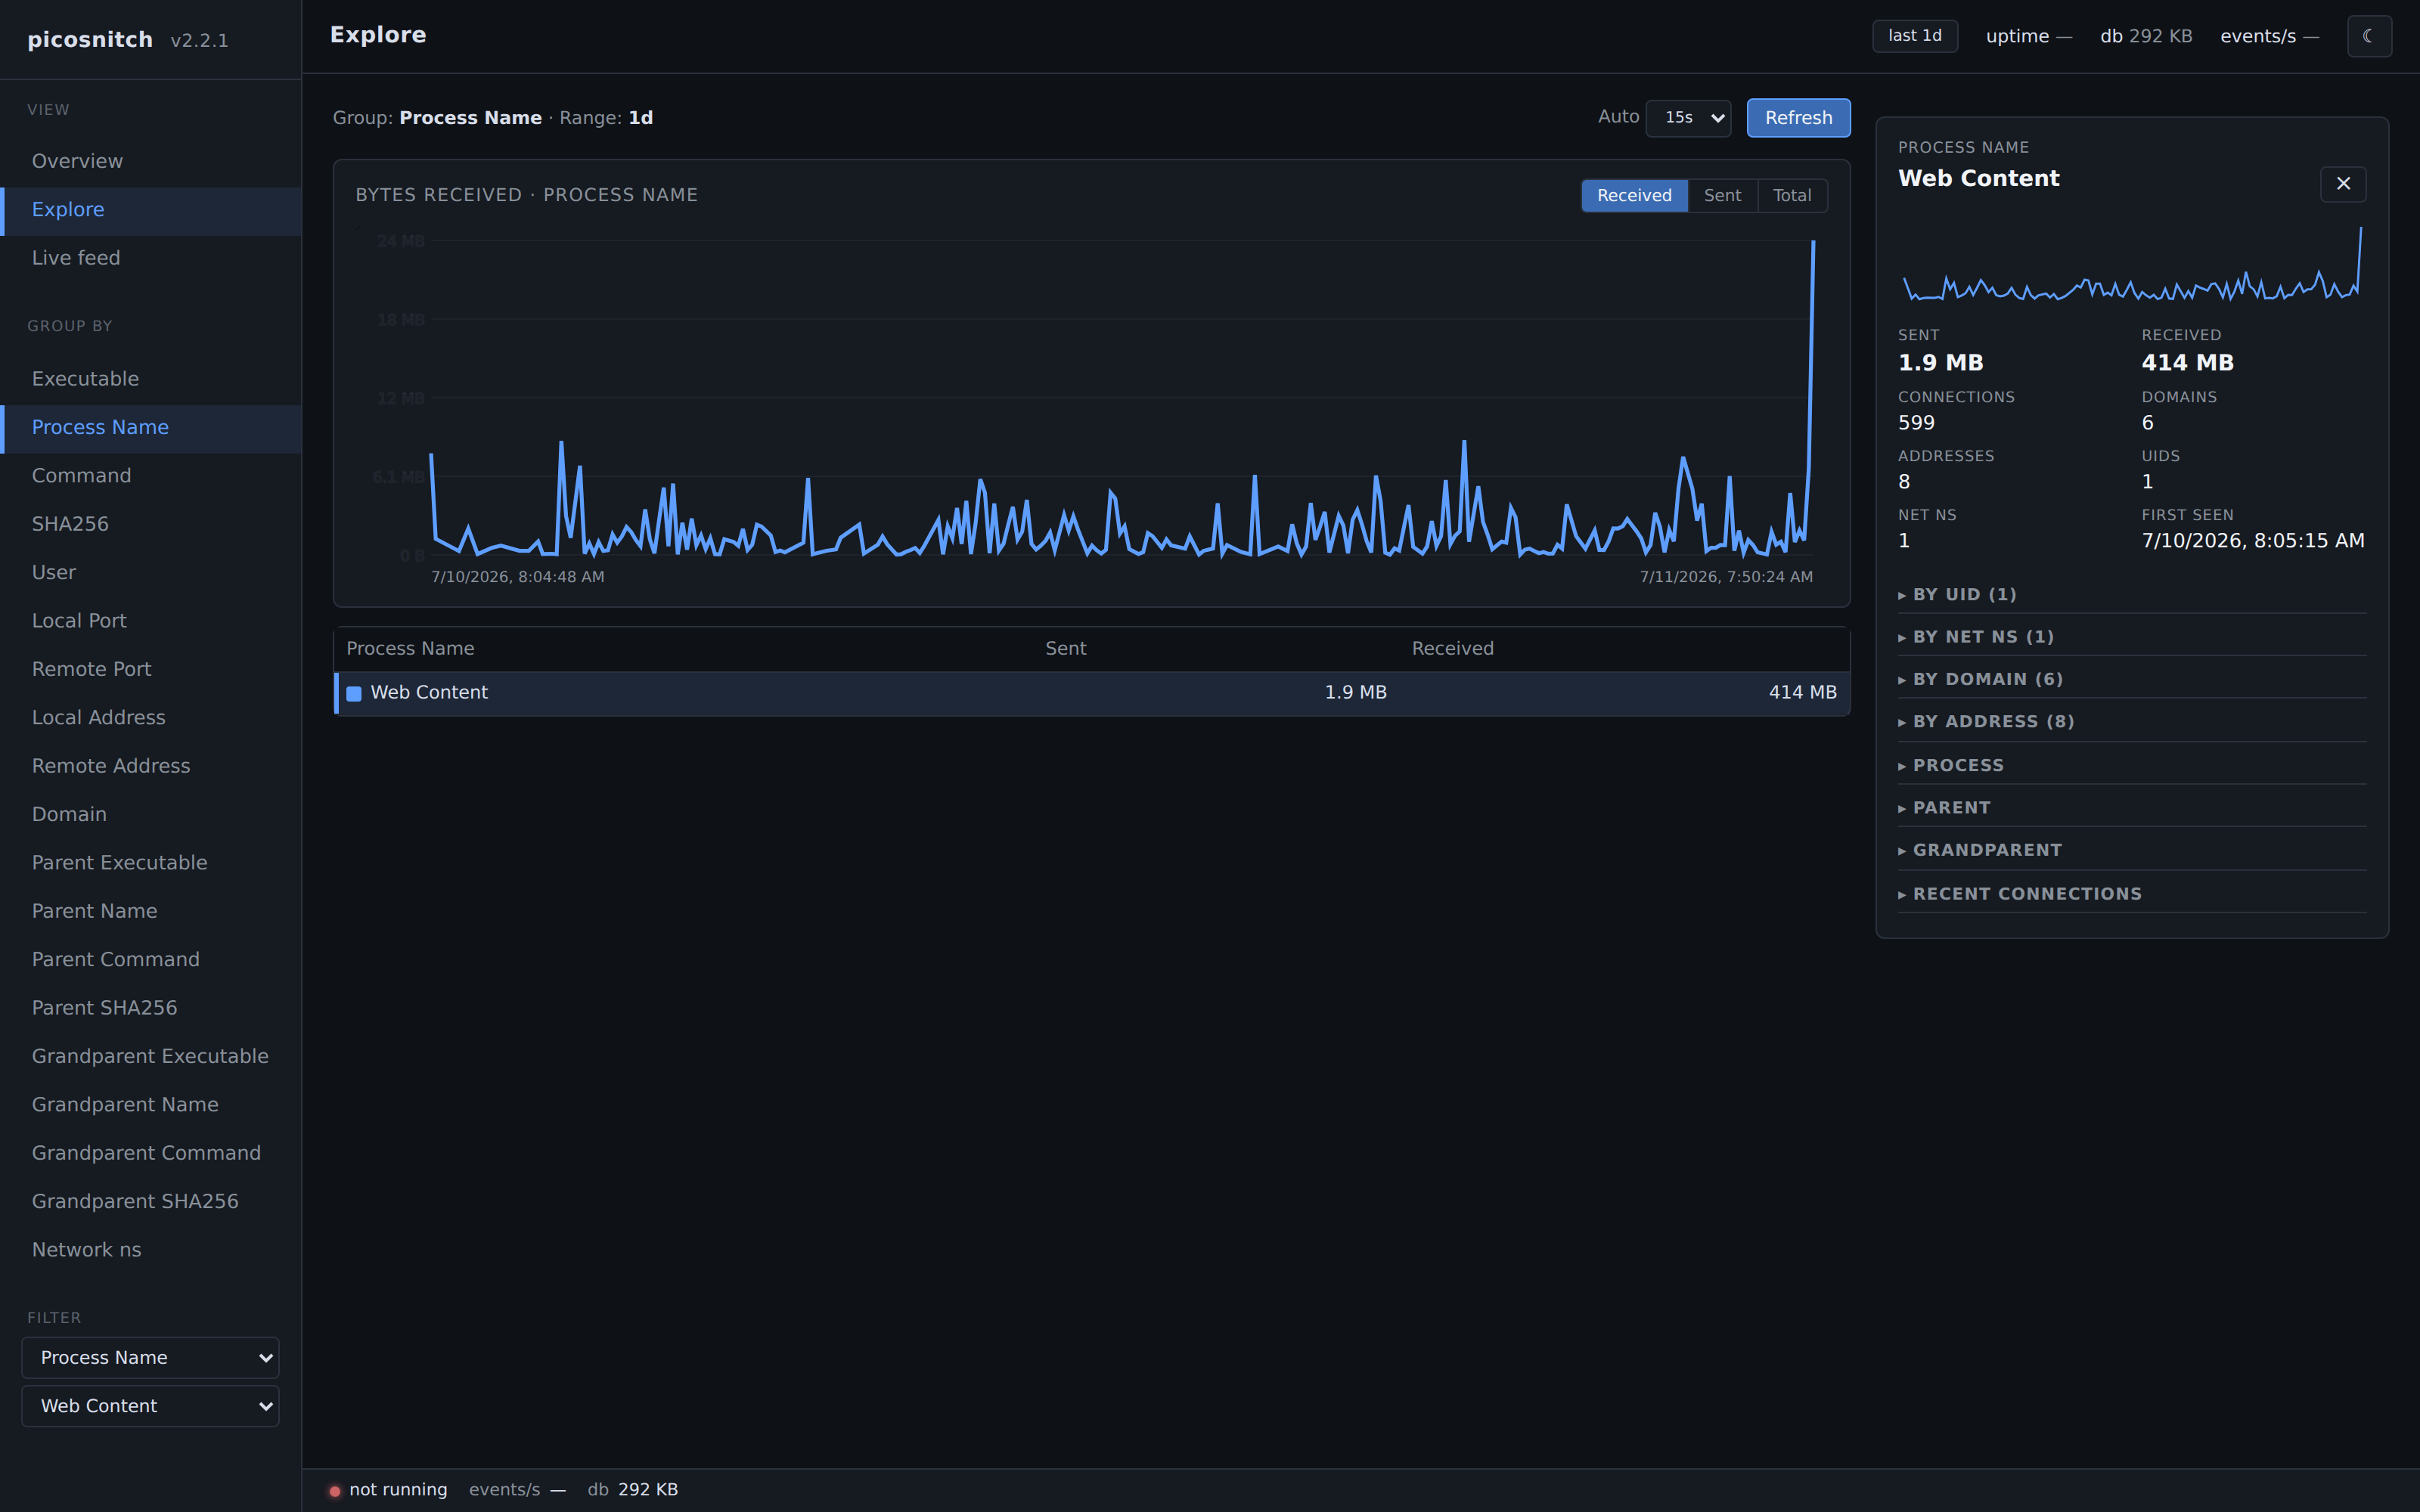
Drill-down on a single executable
Filtering by an executable opens a detail panel with byte counters, plus by-UID, by-network-namespace, by-domain, and by-address breakdowns for just that binary.
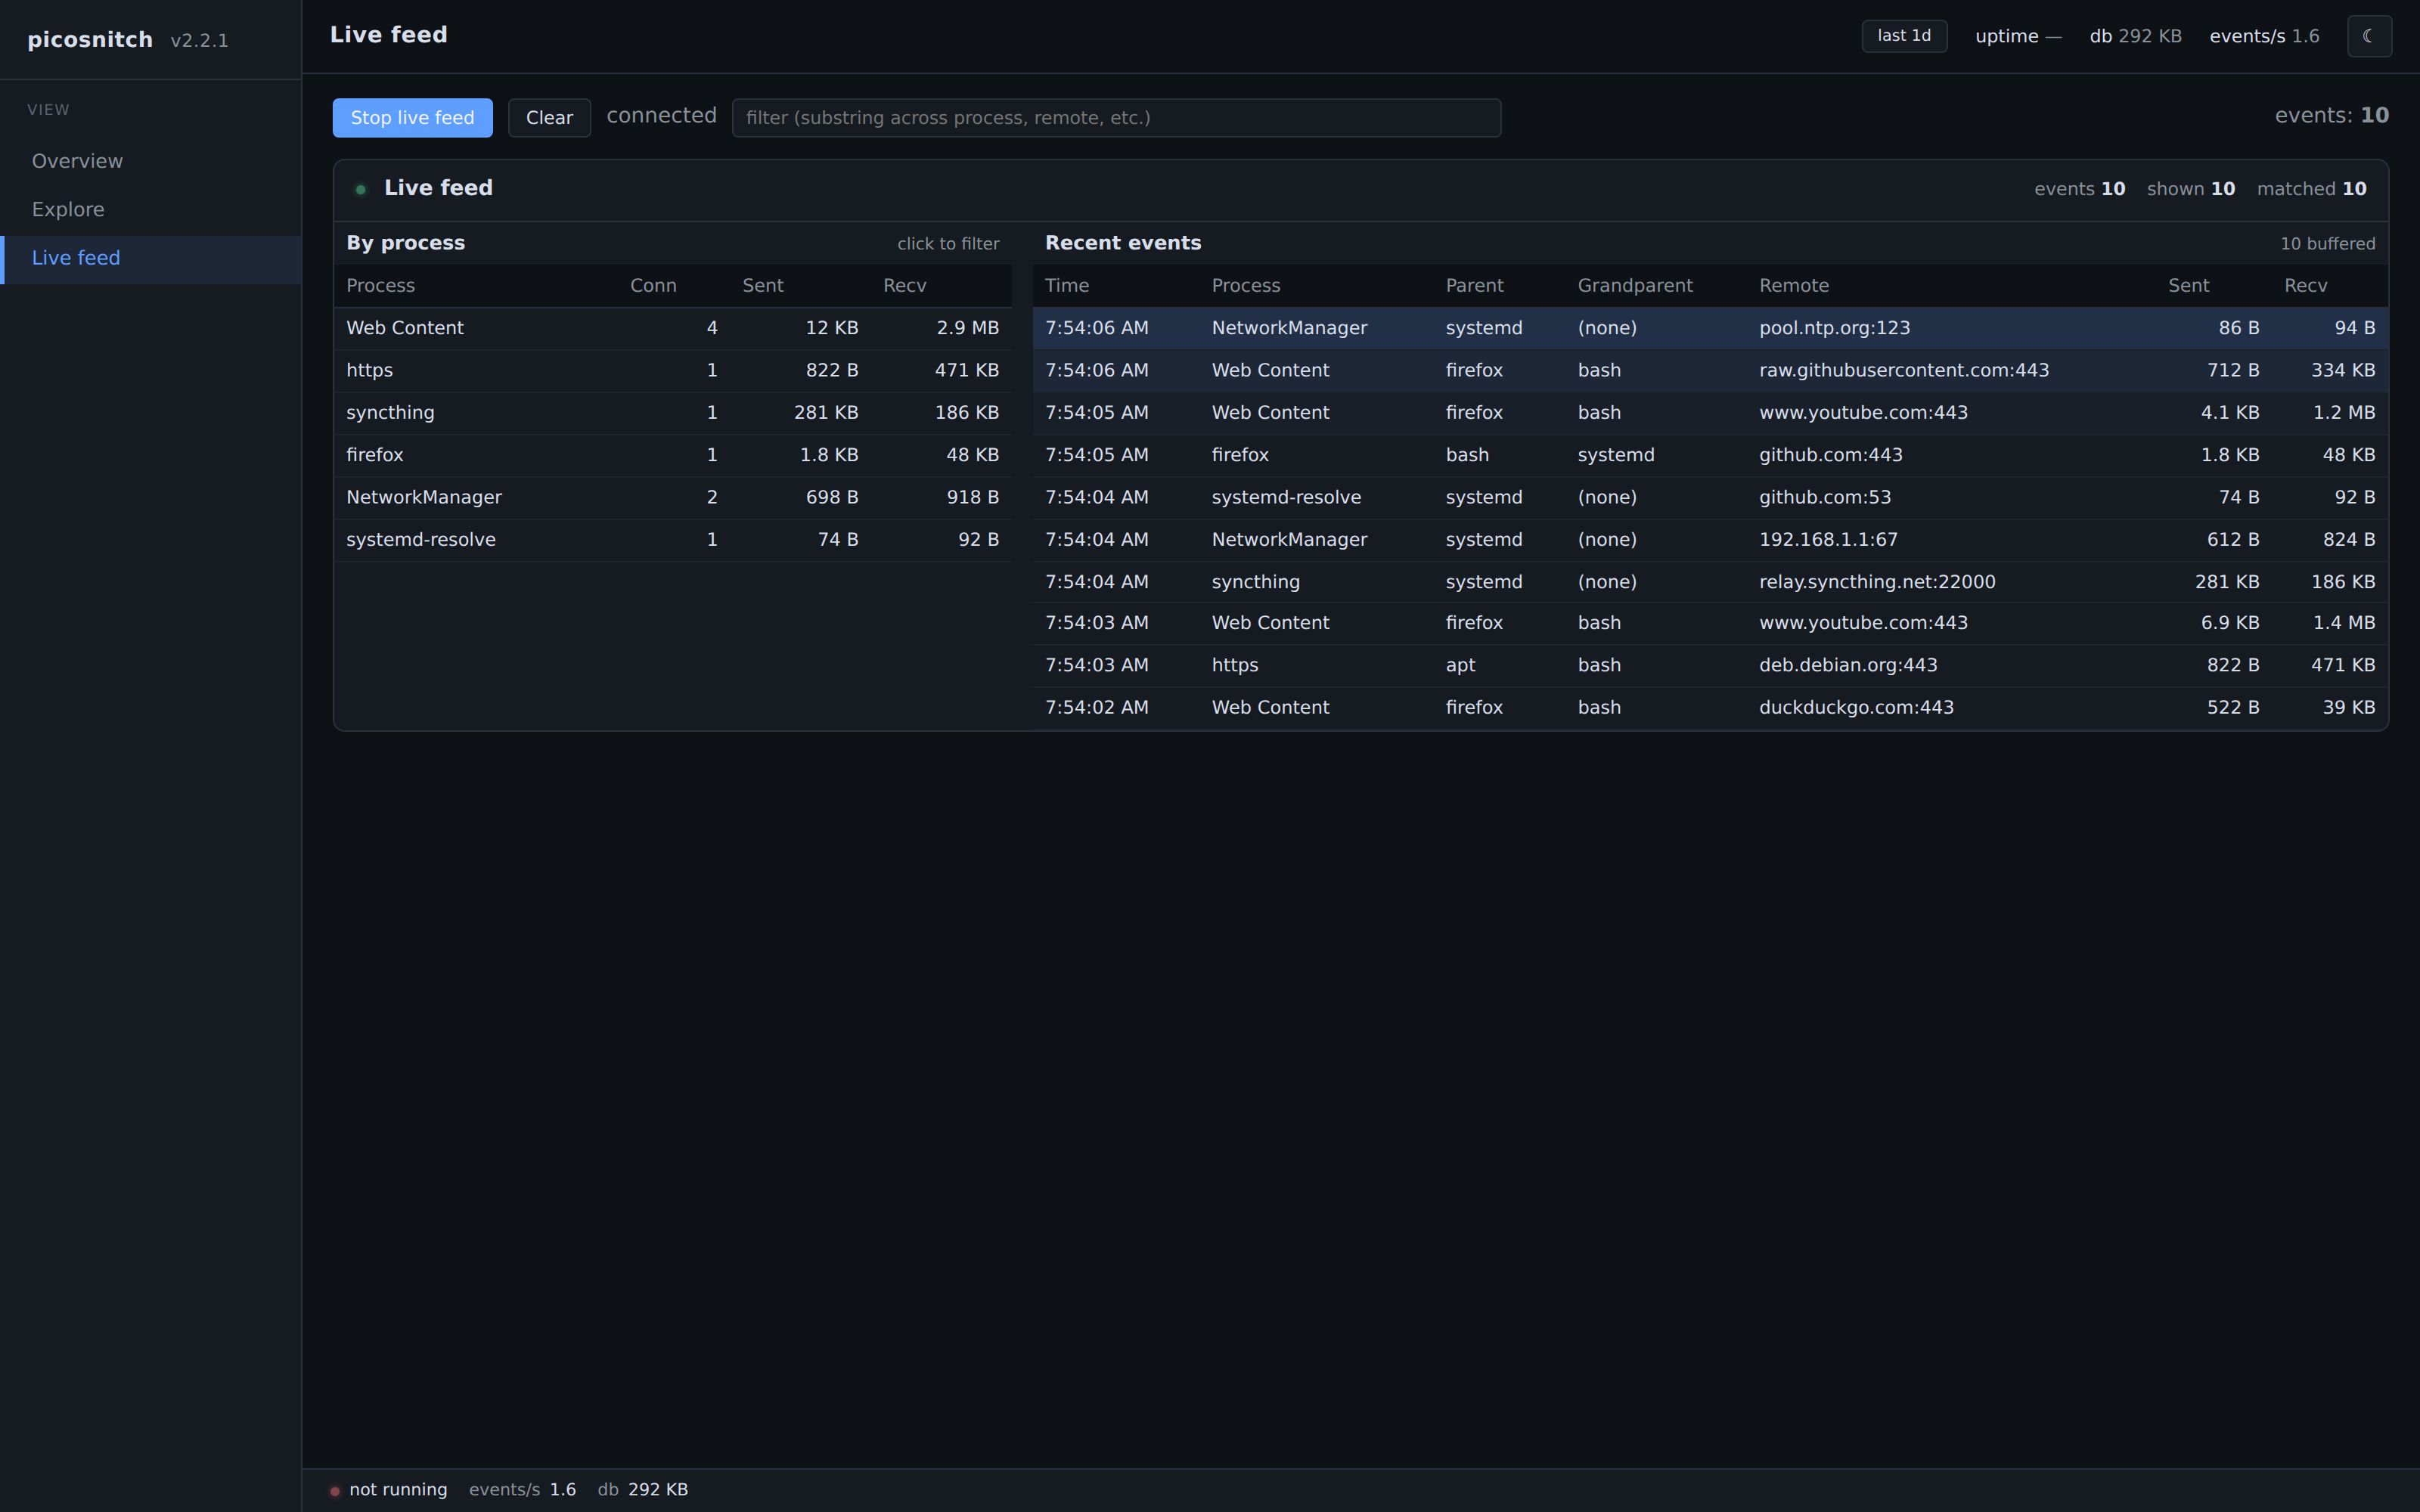
Live tab
The Live tab streams new events from the daemon as they happen, the
same source picosnitch top uses.
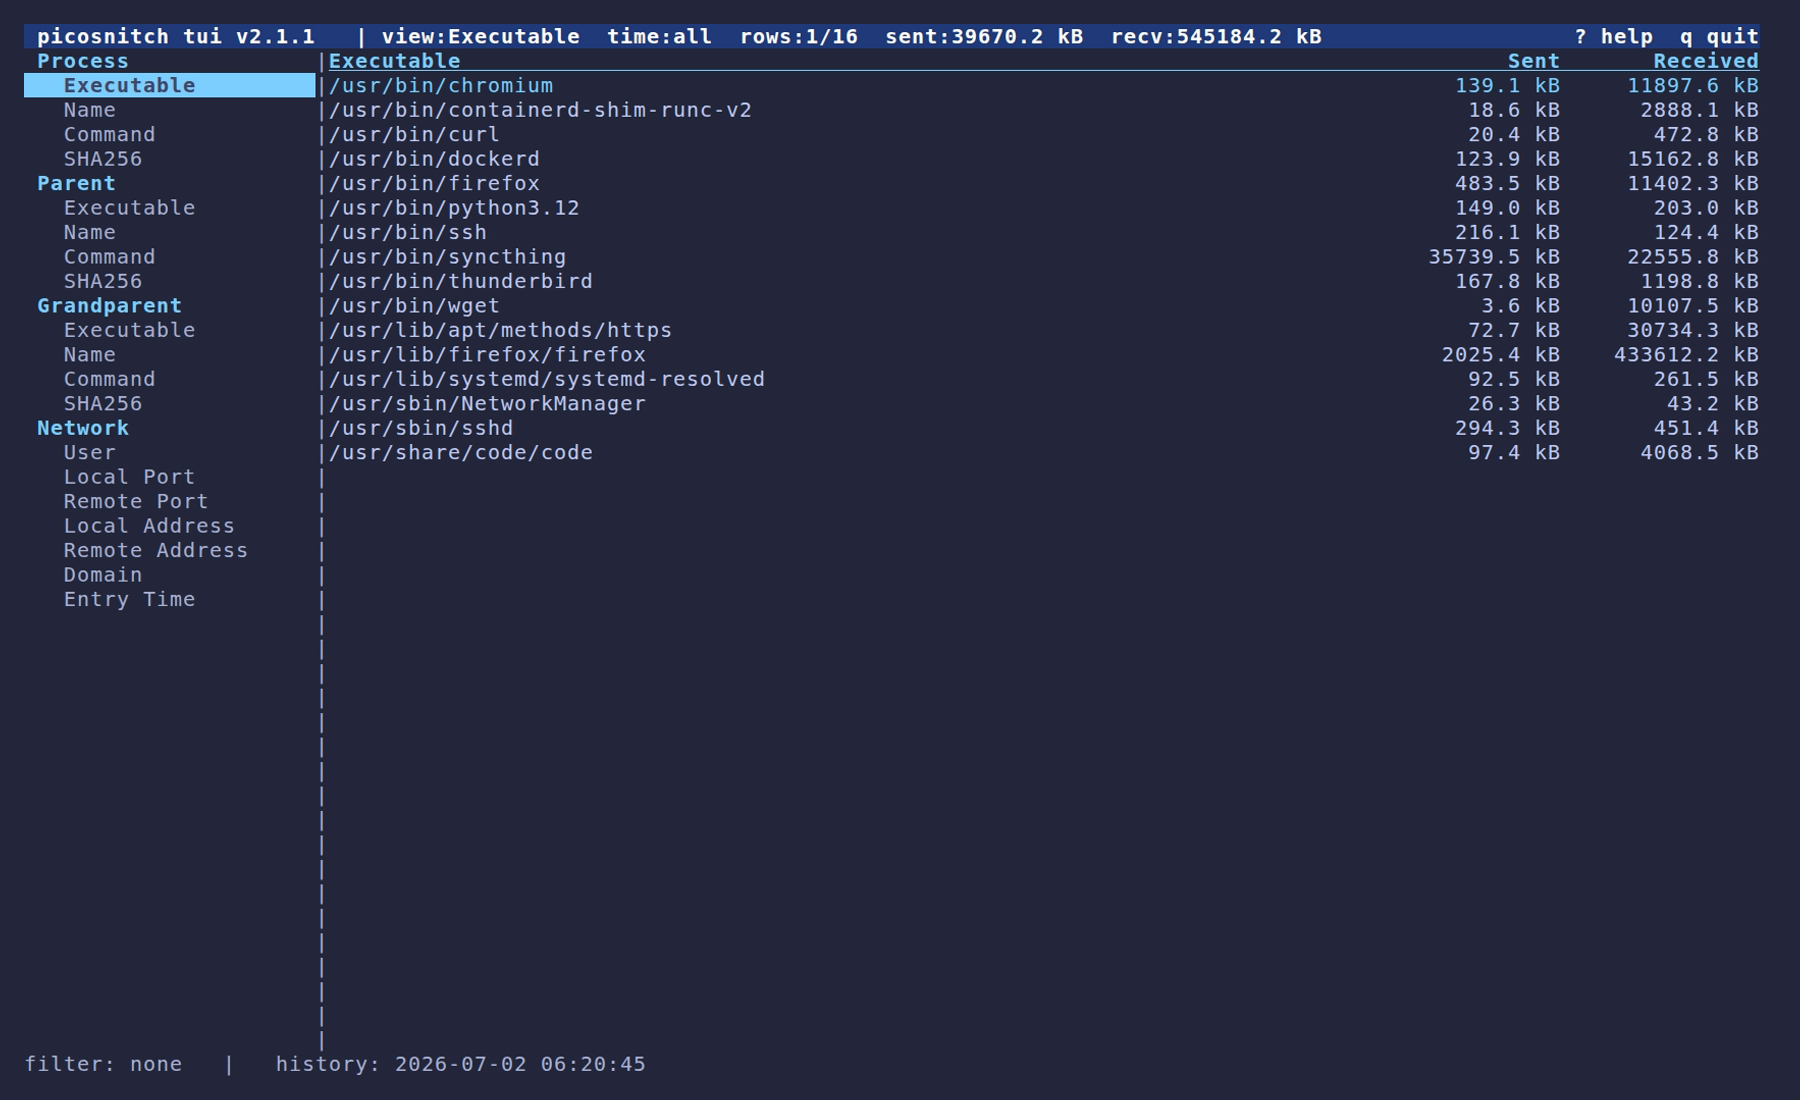
Terminal UI
picosnitch tui is a curses view of the same database, useful over
SSH, on headless boxes, or when you just want a quick look without
spinning up a browser.
Group by executable
The default view: bandwidth grouped by the full executable path. Use the sidebar to re-bucket by name, command, hash, parent, or a network axis.
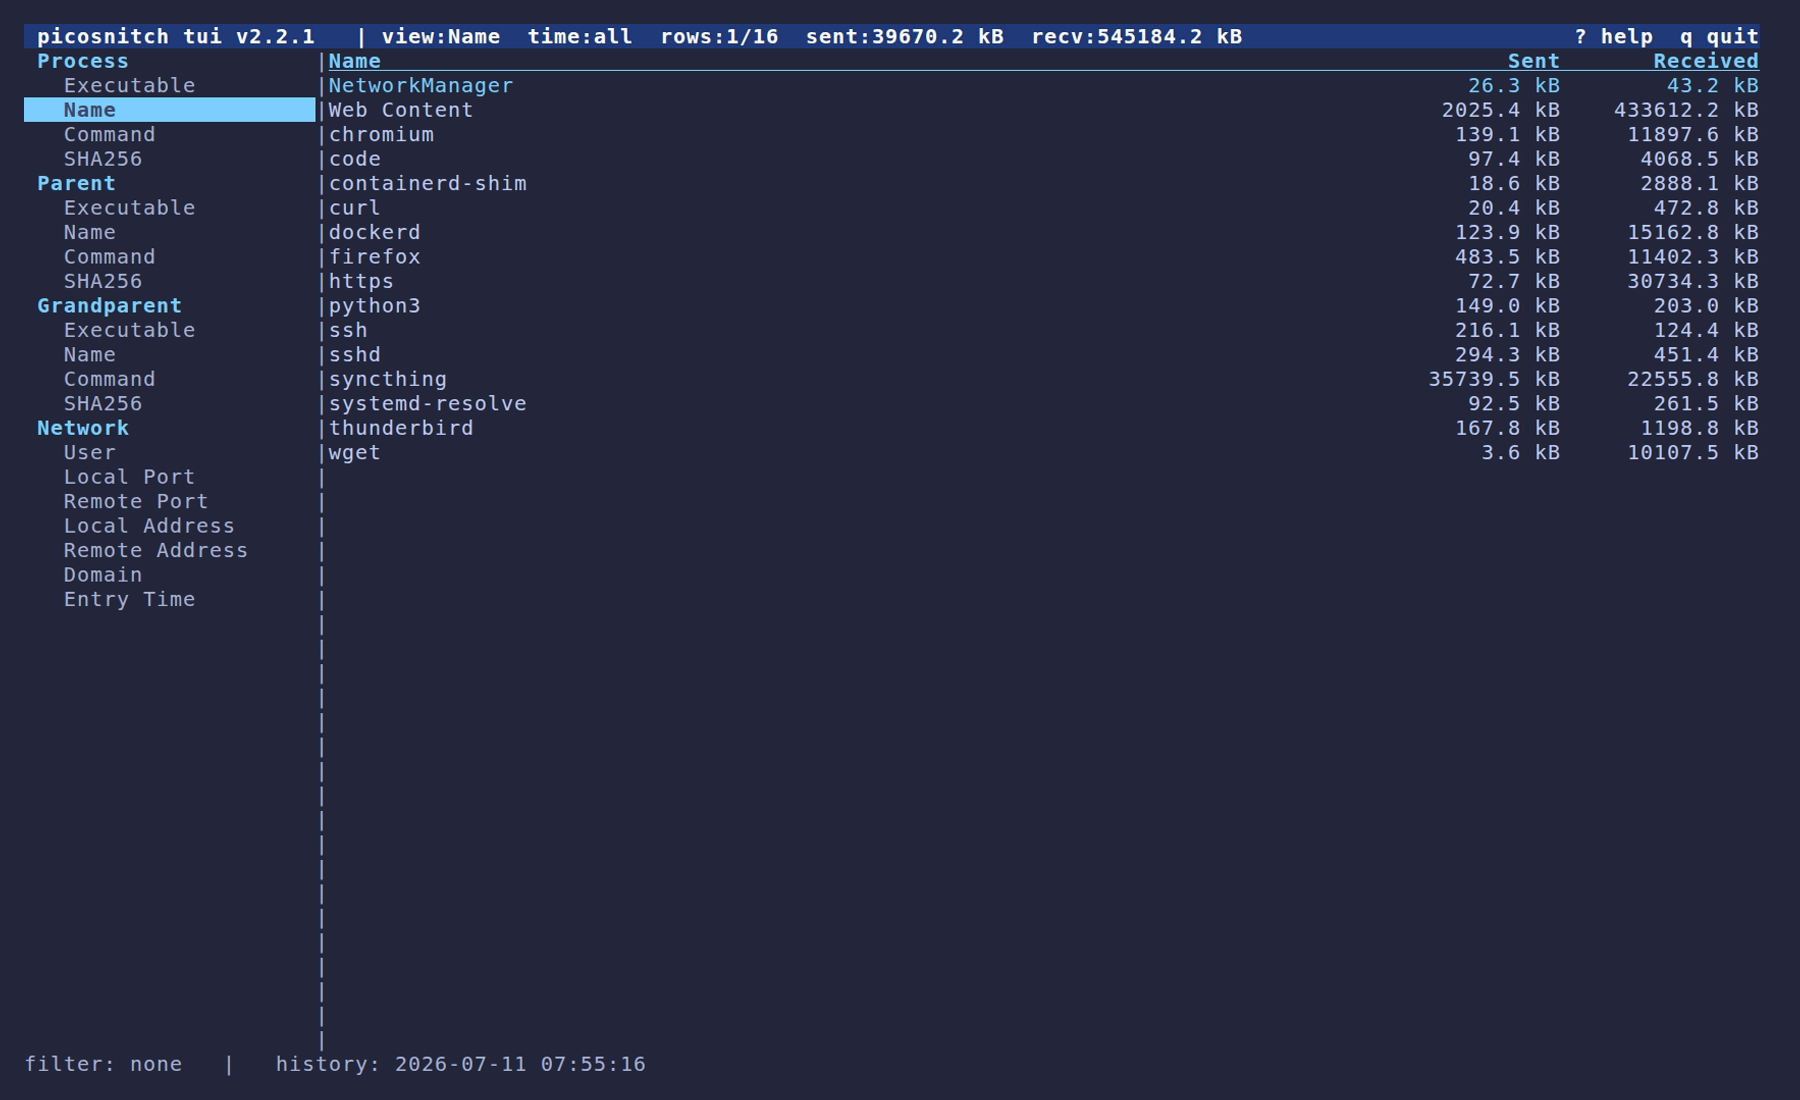
Group by process name
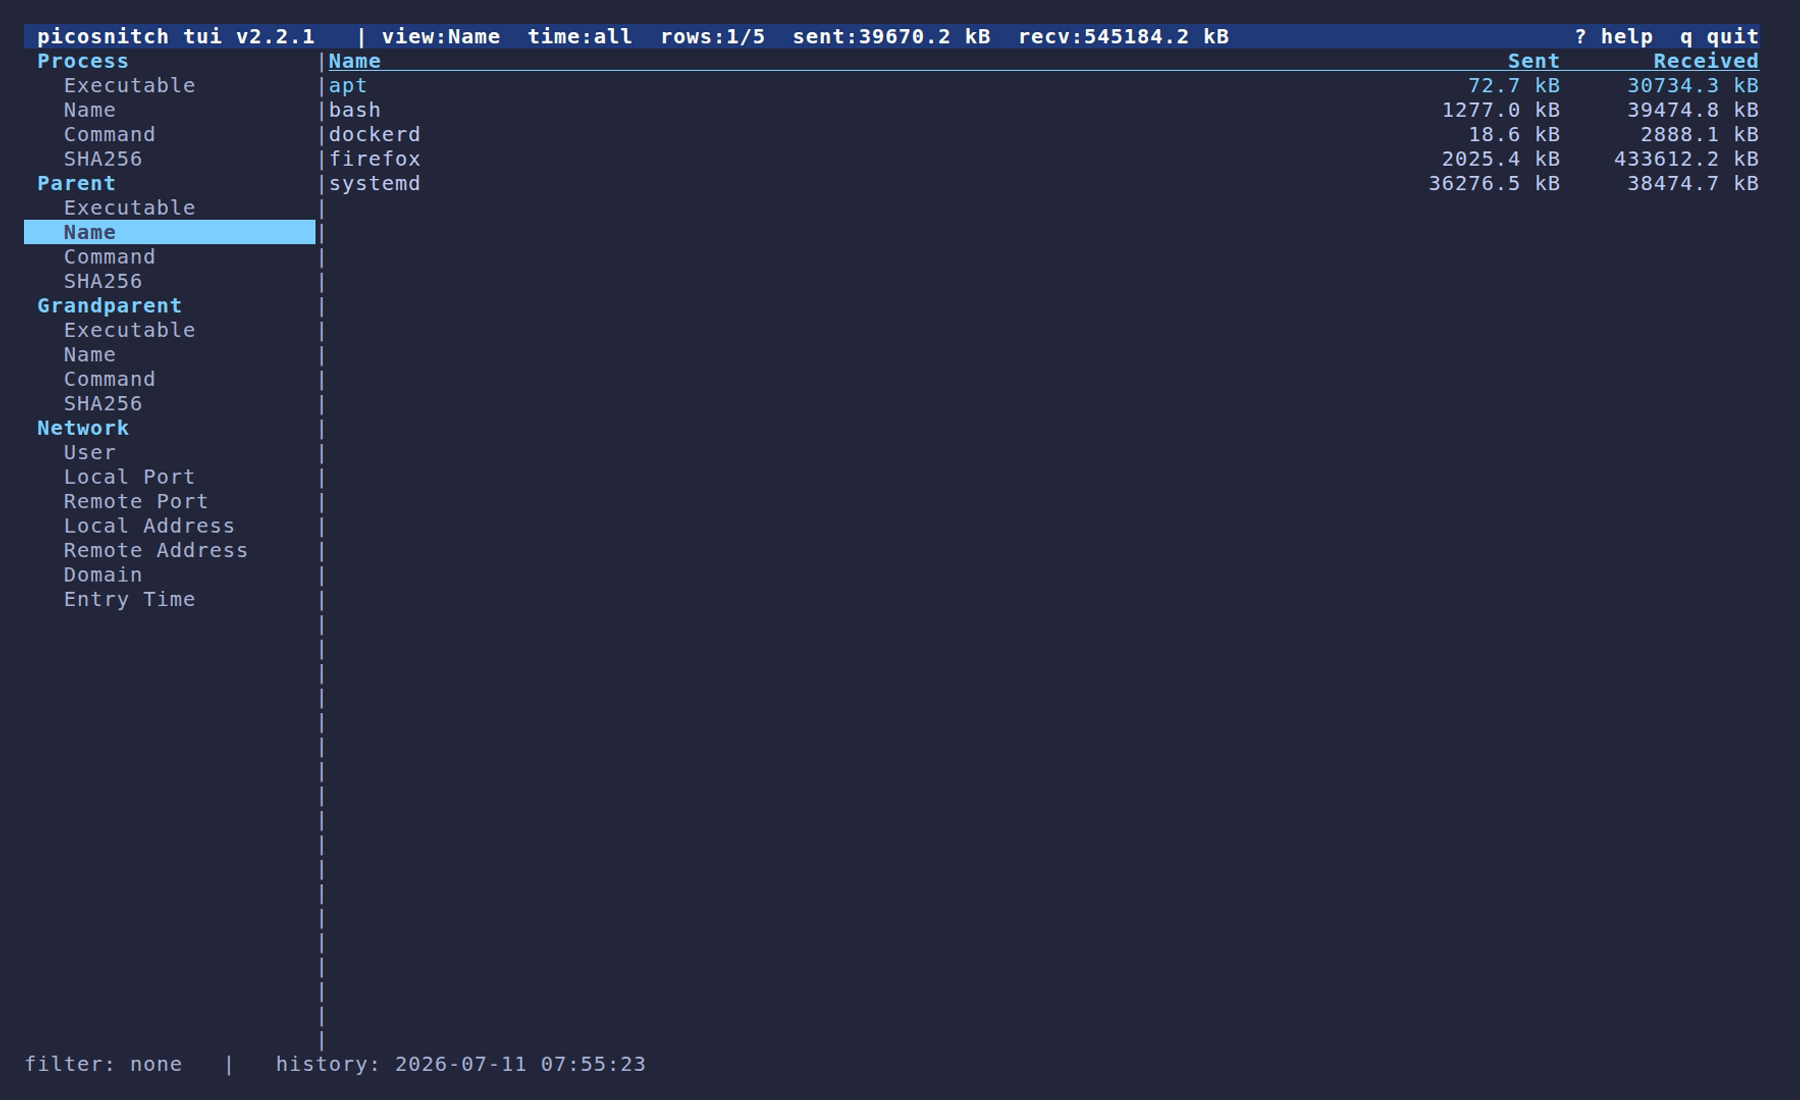
Group by parent
Same data, regrouped by the parent process of each connection.
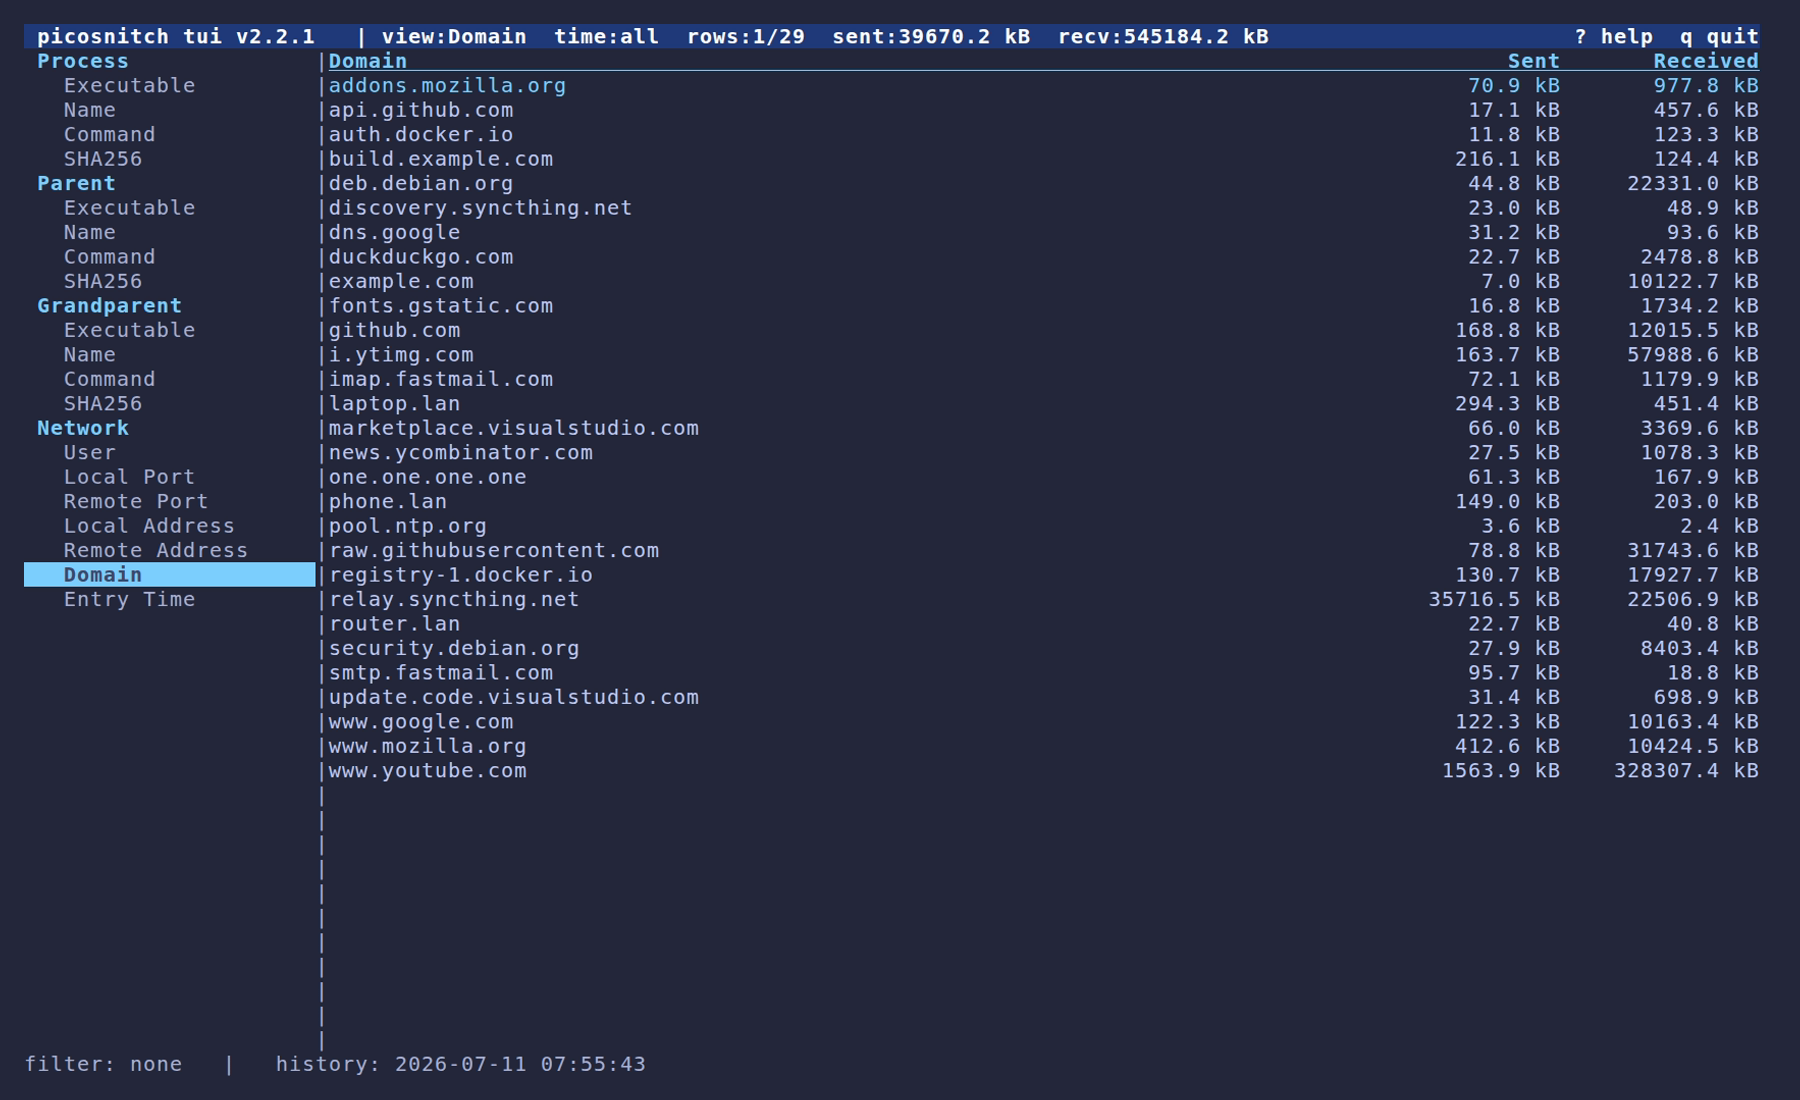
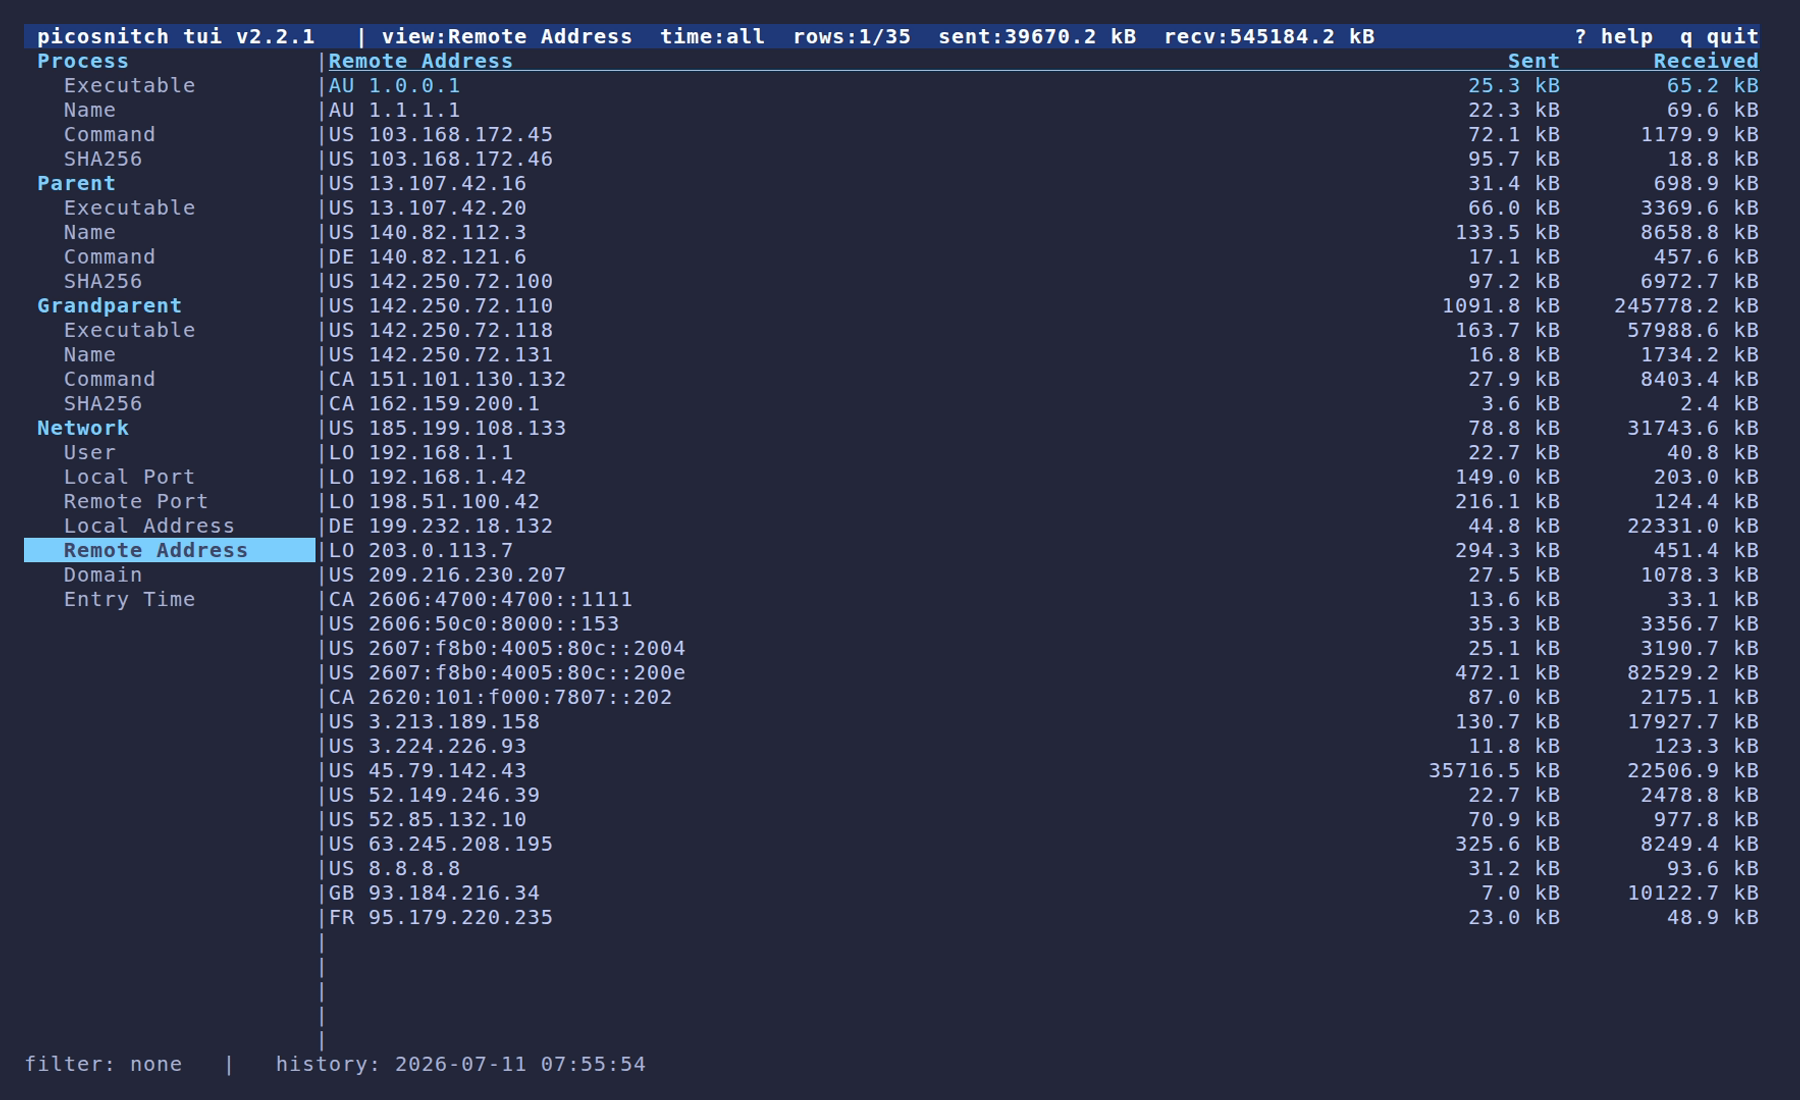
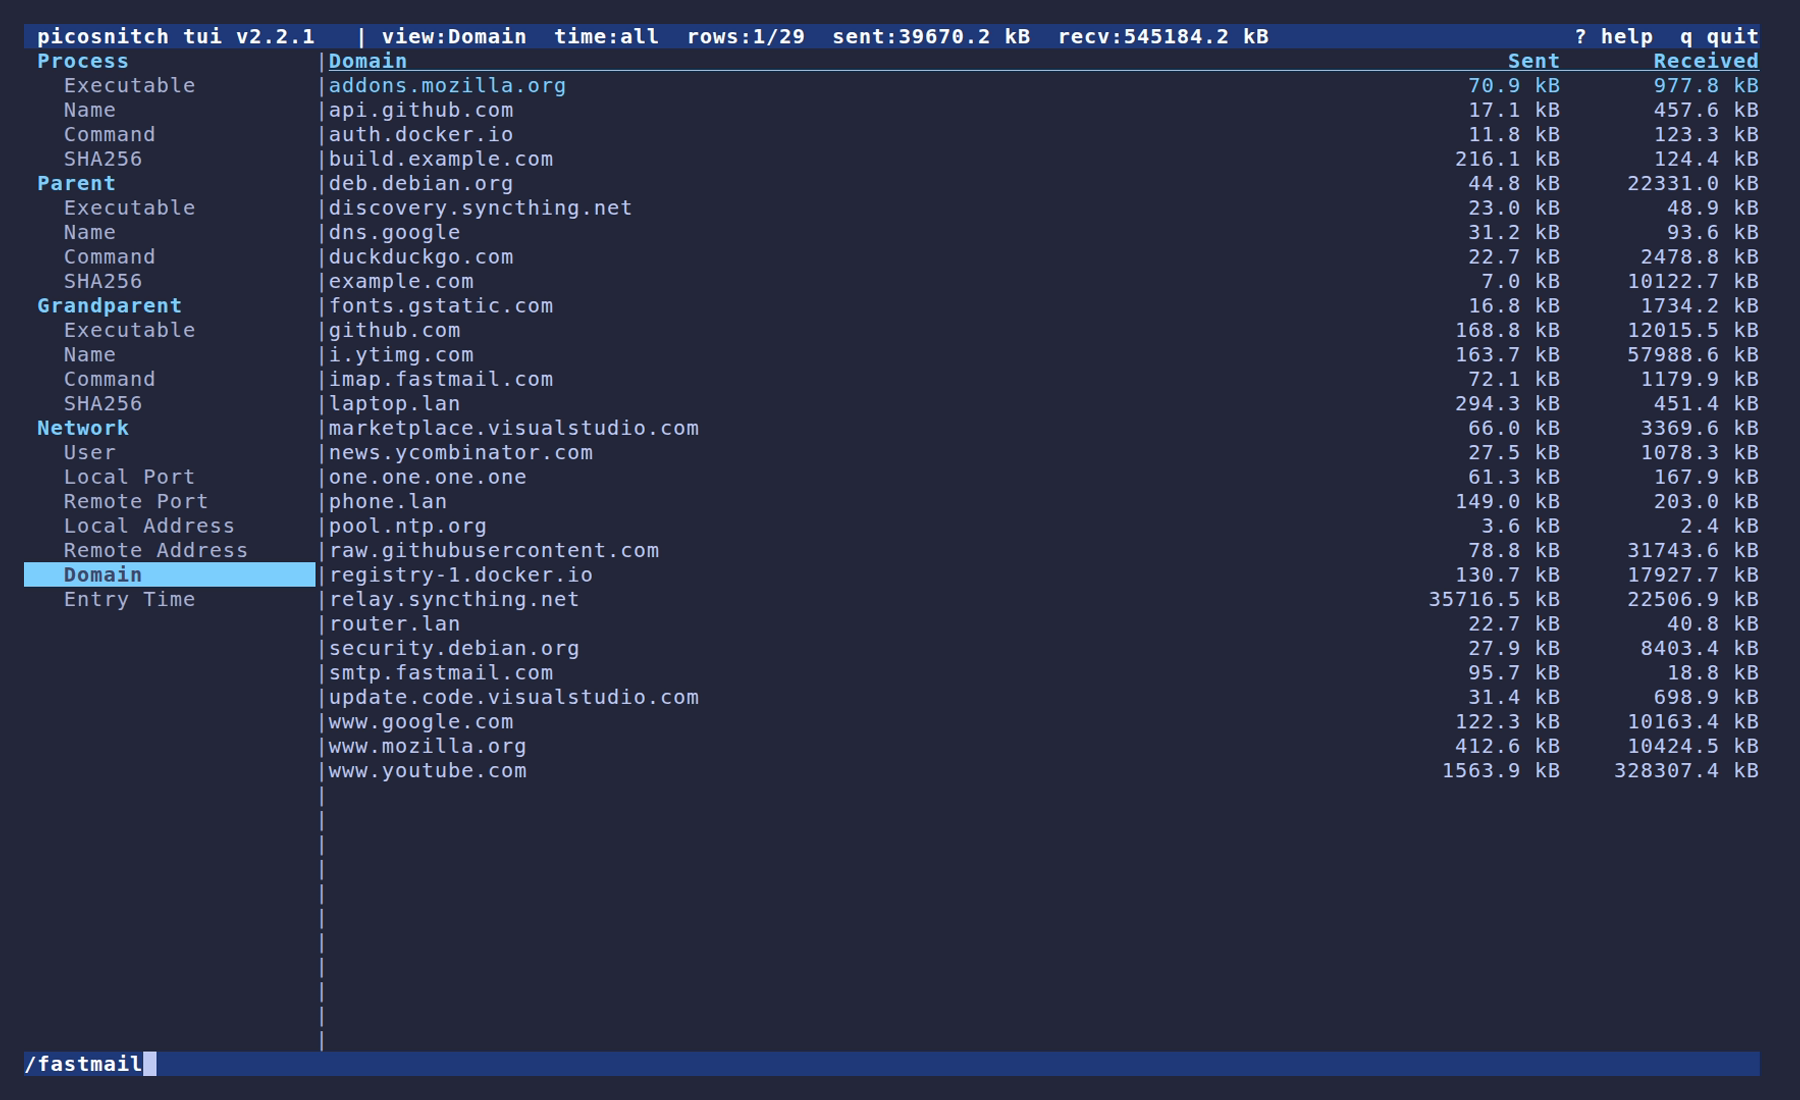
Group by domain
Group by remote address
GeoIP country codes are shown next to each remote address (using the DB-IP Country Lite database, refreshed monthly).
Find filter
Press / to filter the current grouping by substring match.
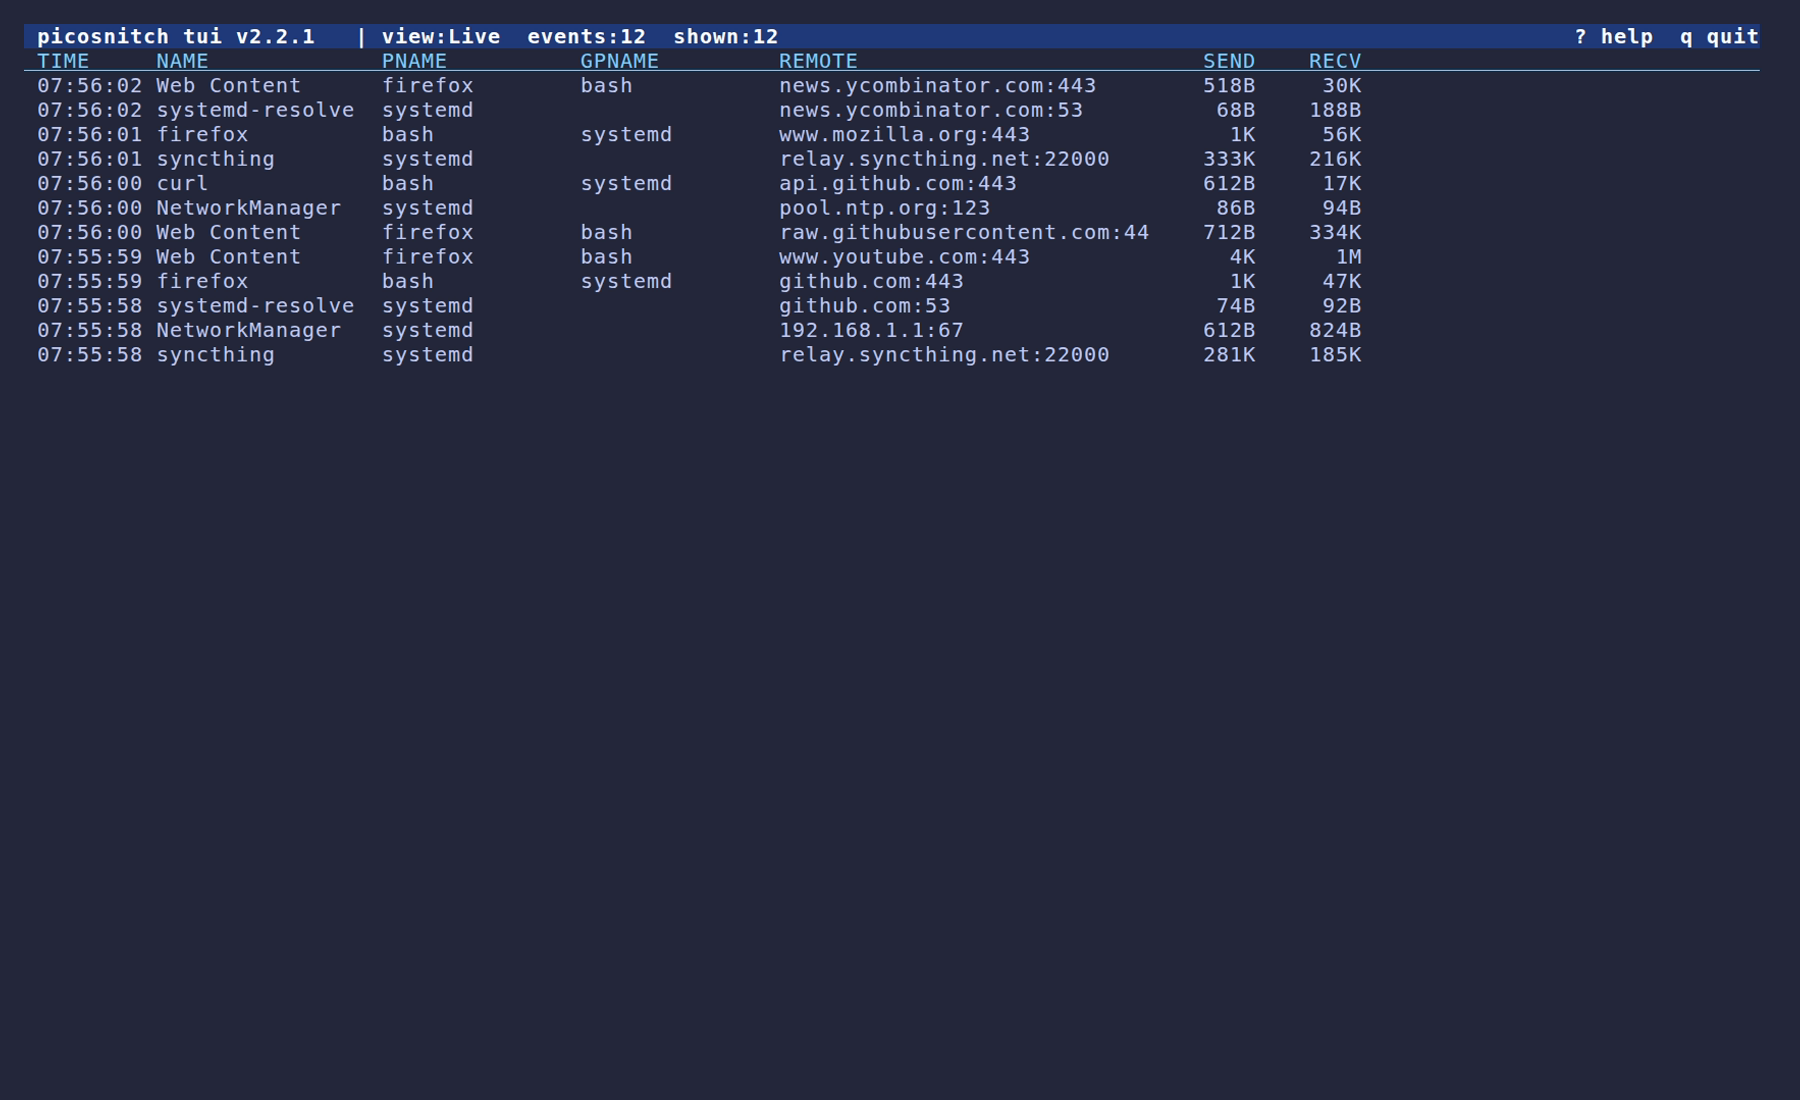
Live tab
The TUI's Live tab mirrors picosnitch top.
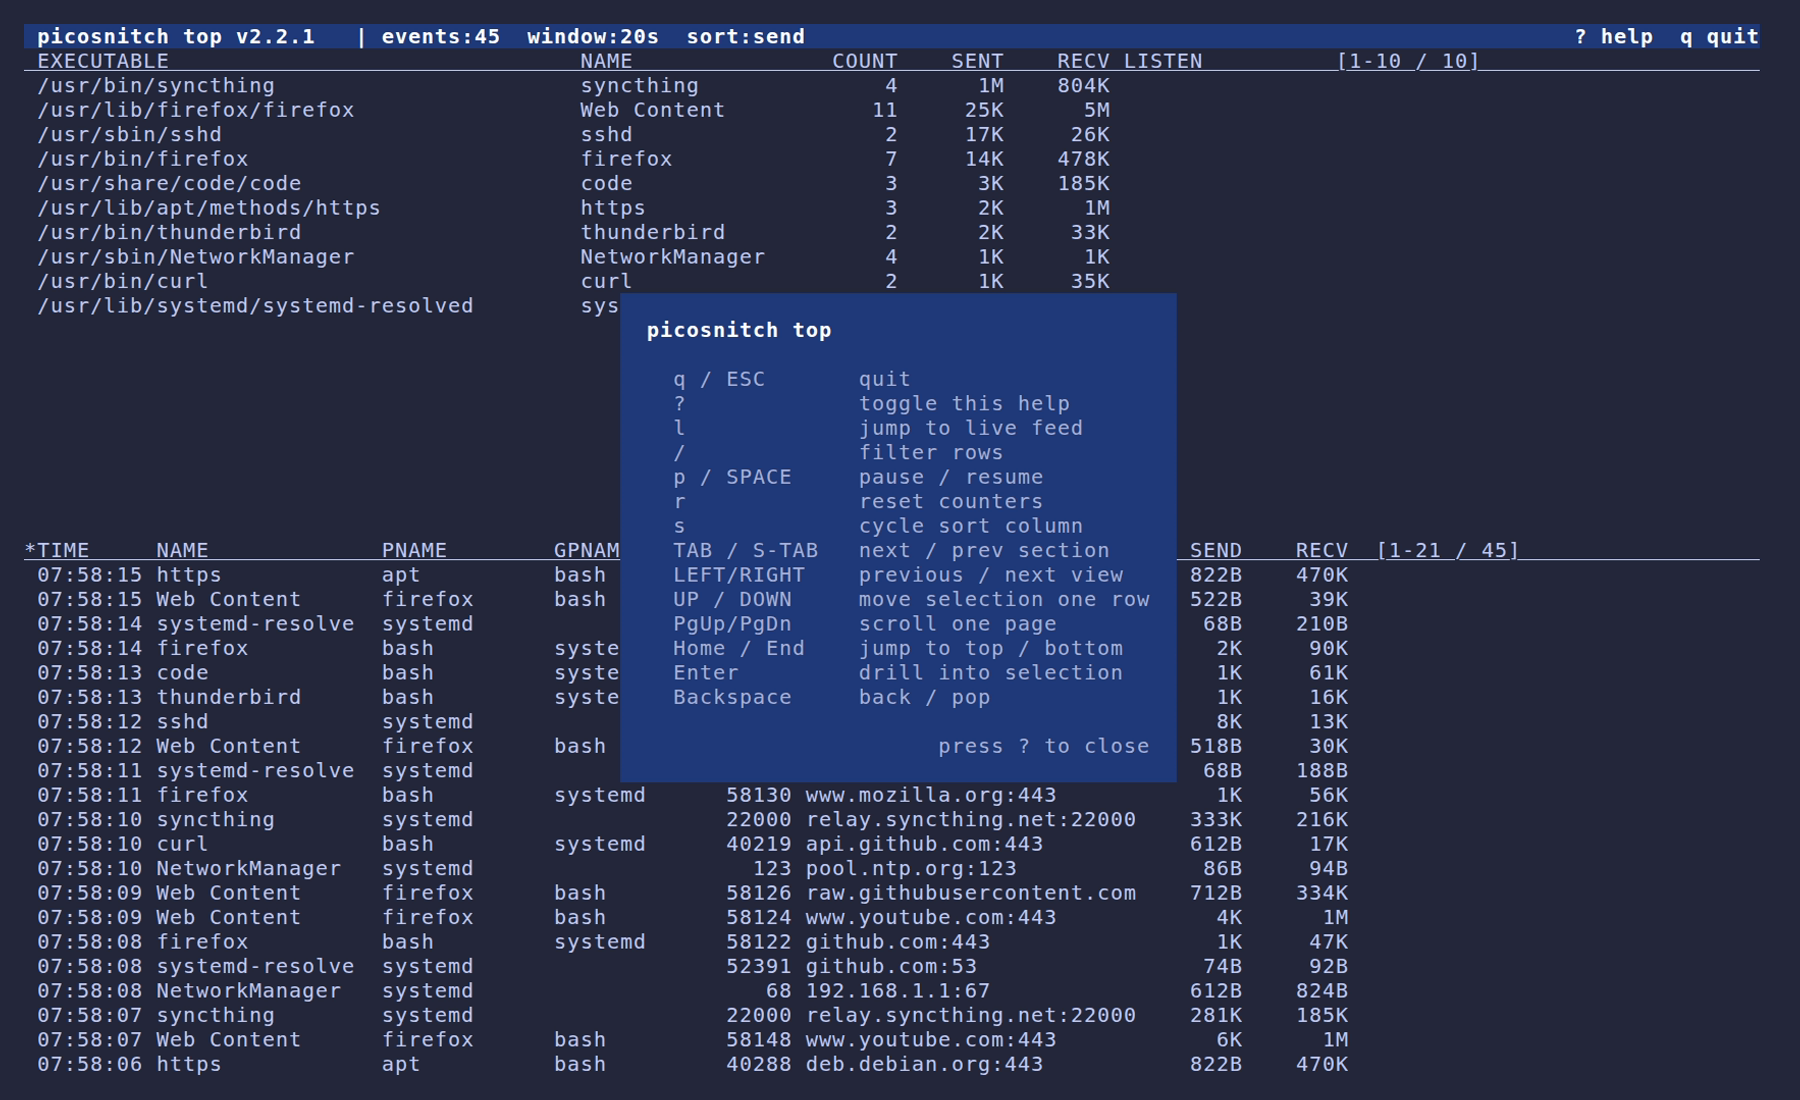
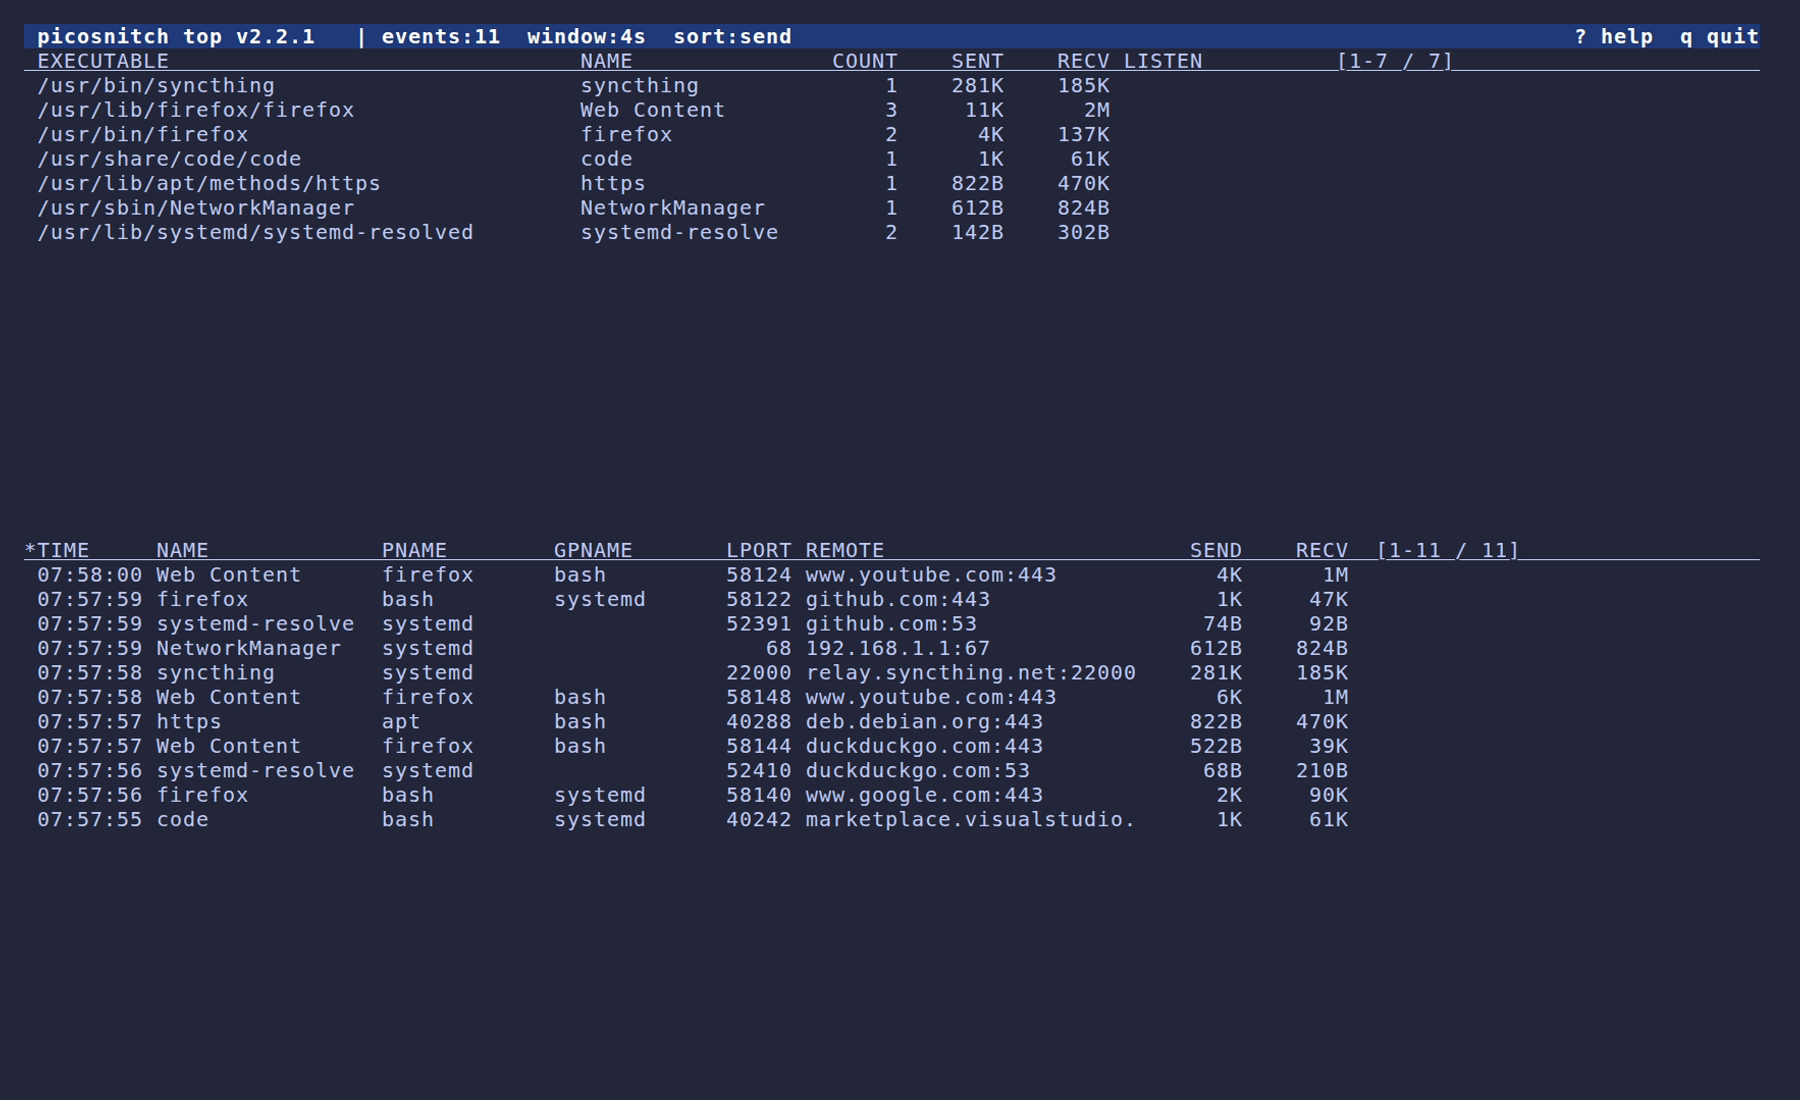
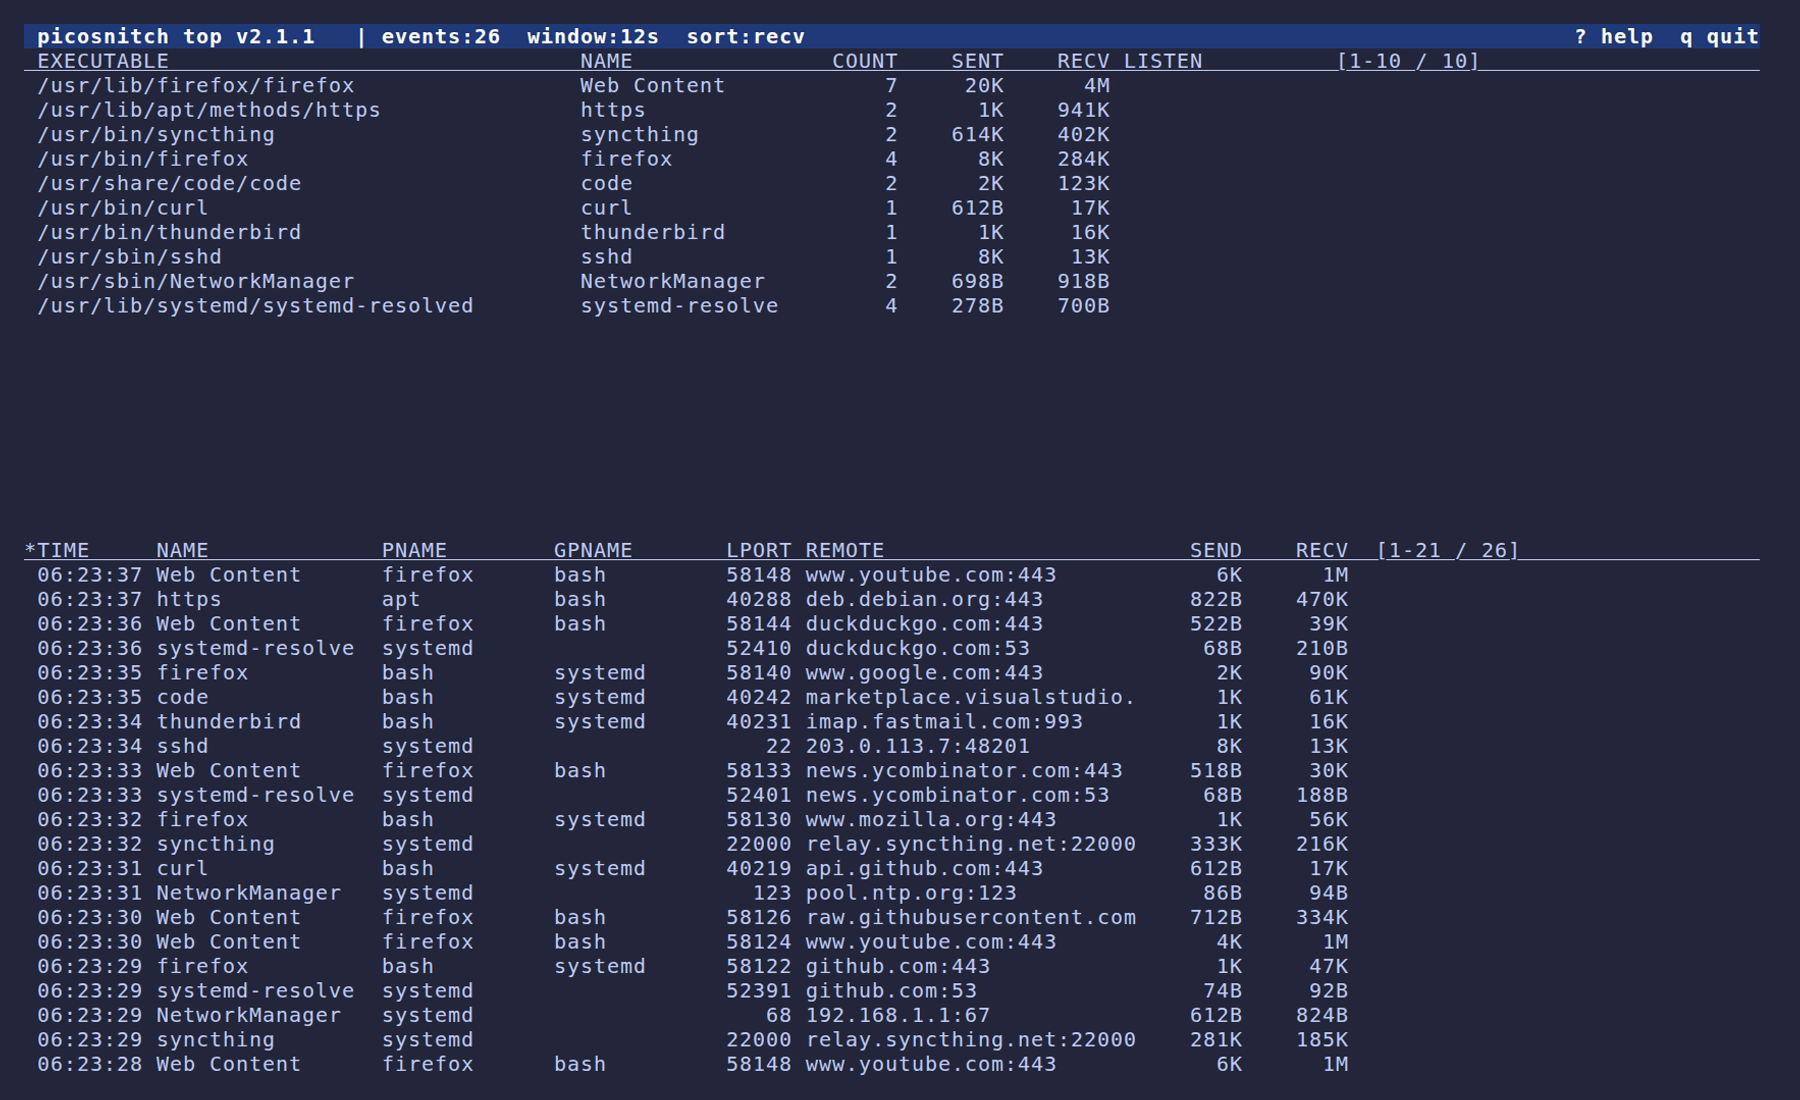
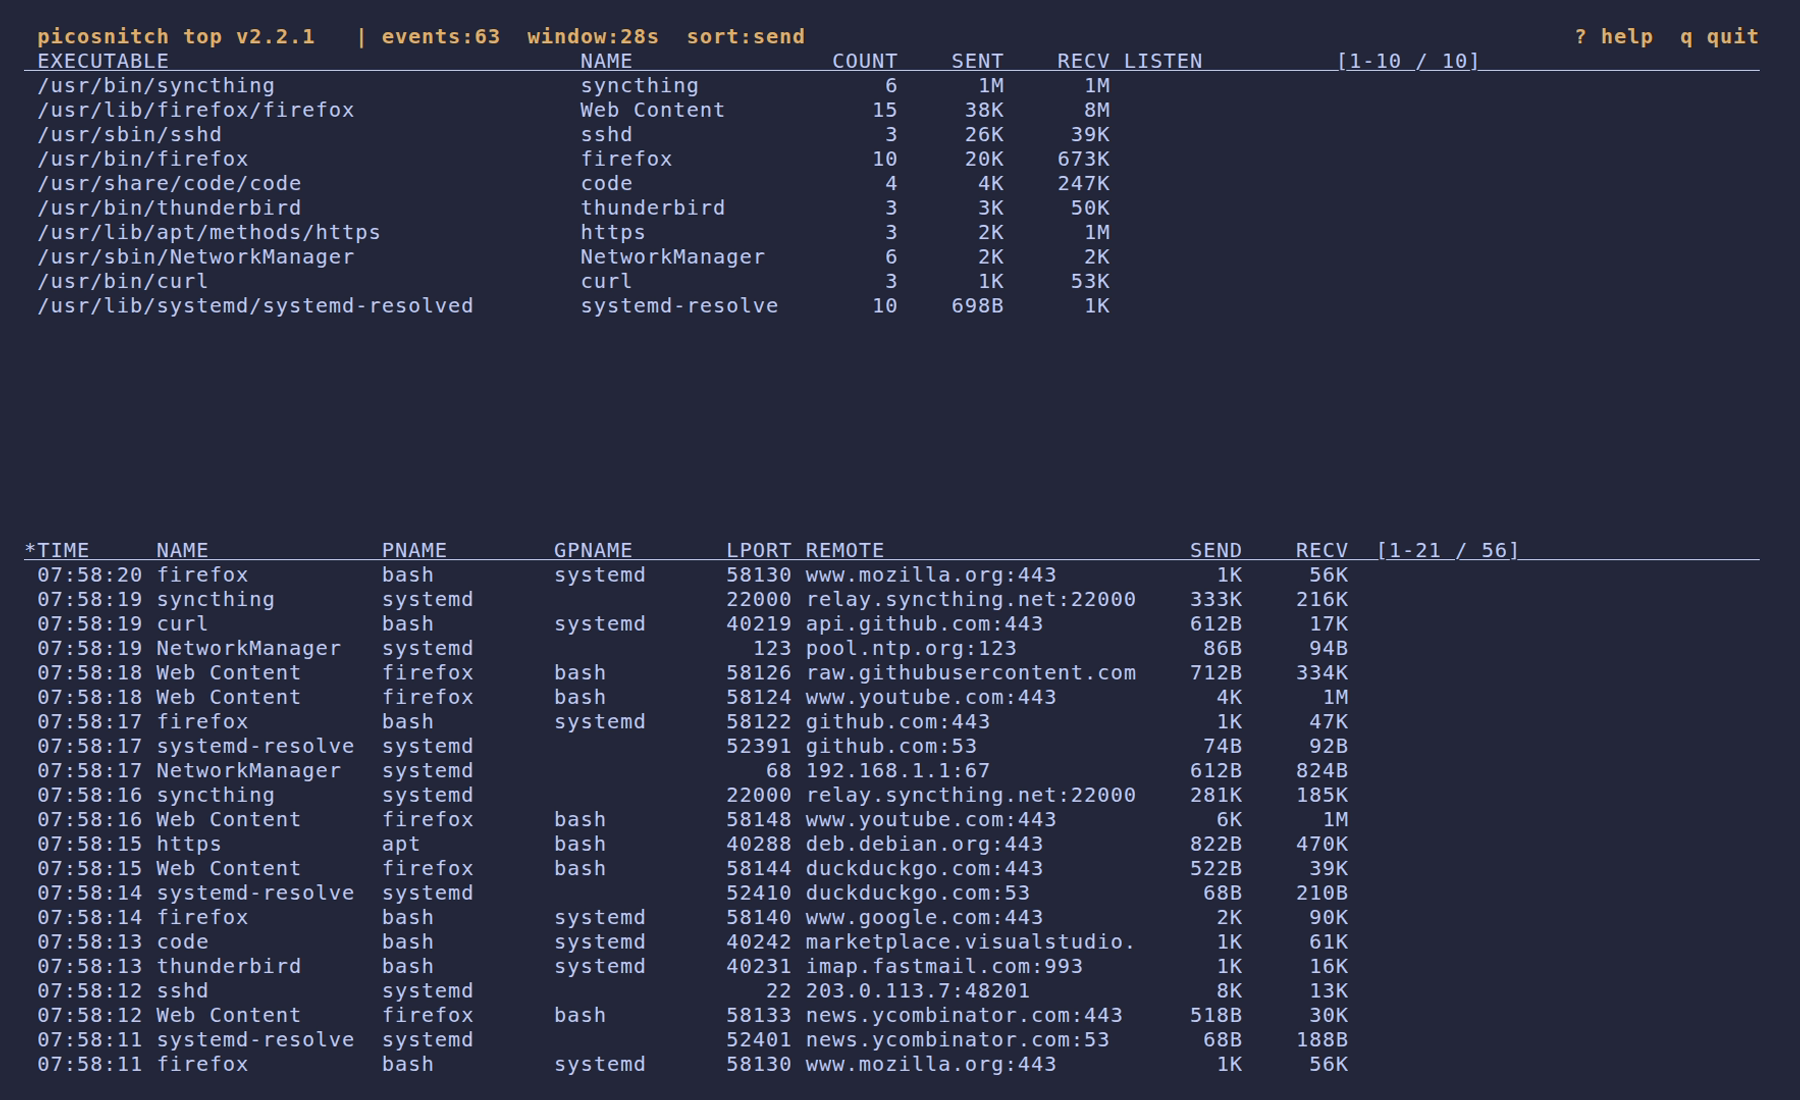
Live event feed (picosnitch top)
picosnitch top streams events from the running daemon over a local
socket. Requires root. Useful for catching what a specific command or
script actually does on the network.
Default view
Sorted by received bytes
Paused
Help overlay